Solid Waste Plan Update 2003
Table of Contents
Executive Summary
Calculation
of Goal for FY2013-14
Chapter 1:
Solid
Waste Data from Orange County FY2002-03
·
Budget for FY2002-03 (and
FY2001-02) Table 1a –1d
·
Disposal Tons and Revenues at
landfill Table 1e – 1h
·
Recycling from various programs Table
1i
Chapter 2:
Major
New Solid Waste Activities
·
Summary of major new solid waste
activities by Orange County Solid Waste Management Department 2000 through
2003 Table 2a
·
Summary of major new solid waste
activities by individual jurisdictions FY2000-03. Table 2b
Chapter 3
Solid
Waste Planning Update
Evaluation
of Program Performance
·
Recycling collections for selected
programs FY2001-01 through FY2002-03 Table 3a
·
Orange County household hazardous waste program cost analysis Table
3b
·
Other hazardous wastes 2000
through 2003 Table 3c
Financing
Disposal
Options and Intergovernmental Cooperation
Location
of Solid Waste Management Facility in Orange County
Chapter 4
Summary of plan development procedure
Memorandum to Town Managers about Plan Development
Appendix A Copy of Resolutions Adopting Plan
Appendix B Copy of Advertisement of Public
Hearing(s)
Appendix C Map of Waste Sites Used by Orange County
Appendix D Waste Characterization Study Excerpts
Appendix E Waste Reduction Goal Sheet
Appendix F Plan Elements
Appendix G Supporting Documentation, Buy
Recycled Policy, Brochures, Newsletters and Detail on Towns’ Solid Waste
Activities
Appendix H Departmental Goals
Appendix I Financial Plan FY2003-04 through
FY2013-14 (pending acceptance)
Executive Summary
The Solid Waste Management
Department, formerly part of the Town of Chapel
Hill, was officially transferred to Orange County on April 17, 2000. This
Department is still the lead agency for solid waste management and is
responsible for operating the Orange County Landfill, Orange Community
Recycling, and for providing solid waste planning and reporting county-wide.
For FY2002-03, Orange County exceeded 40% waste reduction per capita for the second
year in a row, at 45%, Table 1 below.
During fiscal 2002-03 year,
the Orange County landfill accepted for burial 77,156 tons of waste,
including 56,925 tons of MSW, 20,047 tons of C&D and LCID and 184 tons of
other waste. (Chapter 1) Another 12,391 tons landfilled out-of-county are
reported as generated in Orange County. (See attached County Waste Disposal report and
landfill report, Chapter 1). The same out-of-county locations report receiving
waste from Orange County during FY2002-03 as during FY2001-02.
Table 1: Waste generated from
Orange County FY2002-03
Tons Comments
|
MSW landfilled in Orange County
|
56,925
|
|
|
C&D landfilled in Orange County
|
20,231
|
Includes stumps, inerts
mobile homes
|
|
MSW landfilled outside Orange County
|
4,586
|
|
|
C&D landfilled outside Orange County
|
7,805
|
|
|
Total waste disposed from Orange County
|
89,547
|
|
|
Waste per Capita
|
0.748
|
Base year generation rate:
1.36 tons.
Reduction rate: 45%
|
Ninety-percent of the Solid
Waste Management Department revenues come from landfill tipping fees with the
remainder from a combination of sales of recyclables, mulch, boiler fuel and
scrap metal, grants, tire tax reimbursement and interest income. (See attached
budget for FY2002-03, Chapter 1). In order to continue the current level of
operations, additional predictable, stable sources of financing will be needed
beginning in July 2004. Availability fees are under consideration as might be a
potential tax increase. The Board of Orange County Commissioners (BOCC) will
address these issues later this fiscal year. A more thorough analysis of
financial conditions is part of Appendix G.
Changes in the Solid Waste
Management Plan for MSW Reduction
Over the past three years,
much of this department’s effort to develop a long-term solid waste reduction
plan had focused on two primary objectives. One objective focused on reducing
municipal solid waste (MSW) through development and siting of a materials
recovery facility (MRF) and expanding universal recycling services to increase
waste reduction.
That MRF was the cornerstone
of the original waste reduction plan that is now being modified. The County does
not intend to build a MRF in the near future. Not building a MRF would also
preempt expansion of the types of materials and the sectors served by the
County-operated recycling program. The initial solid waste plan called for, in
sequence, constructing a MRF then expansion to universal rural curbside,
universal multifamily recycling and universal commercial recycling coupled with
commingling of materials. Commingling would increase collection efficiency and
allow curbside collection of mixed paper and types of rigid plastic containers
other than bottles. Instead, planned, near-term recycling program expansions
will be limited to accommodating natural growth in residential and multifamily
sectors and limited expansion of the current small scale commercial glass and
food waste programs.
Construction and
Demolition Waste Reduction Progress
The second objective has been
reducing construction and demolition waste. In the past year the County has
developed a construction and demolition waste recycling program at the landfill
complemented by the implementation of a Regulated Recyclable Materials
Ordinance banning disposal of scrap metal, wood waste and cardboard. Next year,
this will be complemented by a new C&D landfill. In the first year of the
new program C&D waste was reduced 23%. Recycling of source-separated clean
C&D wood, scrap metal and corrugated cardboard at the County's facility as
well as diverting mixed C&D to private recycling facilities in our region
rose from 1,100 tons to 9,900 tons. (See table 2 below)
Table
2: Construction and Demolition Waste Reduction in Orange County
FY2001-02 v. FY2002-03
|
Where
Managed
|
FY 2001/ 2002 tonnage
|
FY 2002 /2003 tonnage
|
|
Disposed
(Eubanks Rd)
|
27,729
tons
|
19,085
tons
|
|
Disposed
(Elsewhere)
|
7,352 tons *
|
7,805 tons
|
|
Subtotal
|
35,081 tons
|
26, 890 tons (23%
reduction)
|
|
Recycled (Eubanks Rd)
|
1,099 tons **
|
3,311 tons **
|
|
Recycled (Elsewhere)
|
0 tons
|
6,653 tons
|
|
Subtotal
|
1,099 tons
|
9,964 tons (9-fold
increase)
|
Disposal
The lined portion of the
landfill accepting MSW has a projected six years of life remaining at current
rates of use and the current unlined C&D area approximately nine months.
The new fourteen-acre C&D site now undergoing permitting procedures should
last an additional fourteen years at projected rates of use.
At current rates of use, we
estimate the portion of the Orange County Landfill used for MSW will be full in
2009 and we will then transfer solid waste out of county. A specific transfer
station site has not yet been chosen
Planning Approach and
Progress Towards Goals
Historically, Orange County has
developed and maintained an integrated approach to solid waste management. In
1972, the County, Chapel Hill and Carrboro jointly purchased the land and equipment
to operate the landfill. Since that time, the three governments, with addition
of Hillsborough have used the same landfill, signed on to a single set of waste
reduction goals, signed an interlocal agreement pledging their waste to the
County's landfill, and created a solid waste advisory board that represents all
four governments in providing policy recommendations to the BOCC.
The Solid Waste Advisory
Board consists of two representatives from each of the four local governments
and an ex-officio participant from UNC. This Advisory Board has worked further
on the Solid Waste Management Plan and, last spring, endorsed the 61% goal, the
original 1997solid waste plan including a materials recovery facility,
universal recycling collections and commingled collection program with an
expanded list of materials.
In contrast to that
endorsement, the BOCC has determined that, in the near term, the current source
separated collection program will continue and no major recycling program
expansions will be undertaken within the next fiscal year, given the current
level of success in waste reduction activities and the long-term financial
concerns for program stability. Once the financial analysis is completed
and the fees implemented, the Board and the local governments may reconsider
their options for further reducing waste.
The Solid Waste Department
provides recycling services Countywide while each of the four governments
provides some of its own waste collection services or enables contracted
services to operate within its jurisdictions. All four governments have
remained committed to reducing waste, supporting a single, integrated plan goal
and otherwise responsibly managing solid waste.
The goal of 45% diversion by
2001-02 was actually met in 2002-03. The longer-term goal of 61% diversion was
reaffirmed in 2000 and again in this 2003 planning cycle, although specific
plans for meeting the goal are delayed past the original 2006 date until later
in the ten year planning cycle. This postponement is due to changes in
financing and other considerations by the local governments in Orange County.
Given the current level of
success in waste reduction activities and the long-term financial concerns for
program stability, no additional, major waste reduction activities are planned
at this time. Current programs will be maintained and expanded incrementally
to meet natural growth in rural areas now on the program and all the urban
areas. Some minor expansion in the rural areas over and above growth in the
already served areas is anticipated. Expansions to multifamily collections and
commercial collections will occur as collection and processing capacity
permits.
Program Additions
While the time frame has been
extended, the County continues to make steady progress towards the goal.
Throughout the 1990's, we conducted several intensive and extensive planning
and study efforts to set the stage for further improvements in waste reduction.
No major changes to reducing MSW were implemented as a direct consequence of
those planning studies, however we have implemented several substantive
programs over the past three years that have moved us towards our waste
reduction adopted goals. Many existing programs have also had incremental
improvements.
Over the past two years, new
programs have included the following:
·
Implementation of regulated
recyclable materials ordinance and construction of C&D recycling processing
center, that includes education, enforcement, permitting, licensing and
processing and sale of clean loads of wood, scrap metal and corrugated
cardboard.
·
Oil filters and dry cell batteries
added to recycling collections at solid waste
convenience
centers,
·
Propane tanks now collected at the
landfill,
·
Permanent electronics recycling
drop-off program established at the landfill including storage and processing
facility and at solid waste convenience centers,
·
Phone books, aerosol cans and all
plastic bottles added to curbside, drop-off and
multifamily
recycling collections,
·
Two new drop-off recycling sites
built at Carrboro Plaza Shopping Center and Meadowmont, a new large-scale development in Chapel Hill,
Incremental program changes
included:
·
Increasing participation in our
commercial food waste collection program to over 800 tons annually. Two UNC
sites now on line and the largest Harris Teeter in Orange County. The
Harris-Teeter is the first in North
Carolina to be a permanent part of a
commercial food waste diversion program,
·
Taking over the multifamily
collection program from a private firm, making collections more efficient,
reducing complaint calls and lowering contamination,
·
Expanding hazardous household
waste collection from one day per month to four days per week and reducing cost
per customer 45%,
·
Expanding rural curbside recycling
by 23% from 8,560 homes to 10,500 or over 50% of homes in the unincorporated
area of Orange County.
·
Improvement of mixed paper drop
off recycling collection by seventy percent from an average 50 tons per month
in FY1999-2000 to 85 tons per month last year from all twelve drop-off sites.
Waste Reduction Goals
Calculations
In FY2002-03, we met the
County's 2001 goal of 45% waste reduction. In FY2002-03, 89,547 tons of waste
were generated in Orange County, including waste that was reported landfilled both
in-county and out-of-county. The Orange County population as of June 2002, per the Office of State
Planning is estimated at 119,746. The waste generation rate per capita is then
calculated at 0.748 tons. That is 45% below the FY1991-92 waste generation
baseline of 1.36. tons/capita. The waste reduction goal for FY2013-2014 is
calculated on a separate sheet following this section. It is the same as for
2006, 61% per capita when compared with the base year of 1991-92.
Summary of Chapters 2-4
Orange Community Recycling
program changes, landfill operational changes, and the various efforts for
waste reduction and solid waste management have been incorporated into this
report. They are summarized in Chapter 2 in Table 2a. Table 2b summarizes
work by individual jurisdictions on solid waste issues. Additional details on
work by the individual jurisdictions are included in Appendix G.
Chapter 3 suumarized planning
efforts and program evaluations highlighting recycling program performance
including both solid waste and hazardous waste. Tonnages have increased
annually overall. Costs per person and per pound for collecting andprocessing
hazardous wastes have fallen 26% and 34% respectively. Future program financing
will likely include some supplemental funding to balance expenses and
revenues. Future disposal options will include a County owned C&D landfill
and either public or private out of county disposal of MSW.
Chapter 4 shows the process
for gaining plan approval from the local governments and submitting the plan.
WASTE REDUCTION GOAL FOR ORANGE COUNTY NORTH
CAROLINA
Original ten-year waste
reduction goal for FY2001-02: 45% per capita
Original ten-year waste
reduction goal for FY2005-06: ` 61% per capita
After considering your
government’s current and projected solid waste activities, resources,
population and economic growth, will the FY2005-06 goal change? NO, but
implementation is delayed until further into the ten year planning period.
Why? N/A Delayed primarily
due to fiscal constraints.
CALCULATING AND SETTING A NEW
FY 2013-14 WASTE REDUCTION GOAL
FY2002-03 tonnage landfilled
56,925 tons MSW + 19,909 C&D + 137 LCID + 184 tons mobile homes + 1-ton
alum sludge + (estimated out of county disposal (not including that recycled at
certified C&D facilities 12,392): Total projected to be landfilled during
FY2002-03:
89,547
DIVIDED BY:
Projected
population for Orange County 2002-2003: 119,746 (Office
of State Planning)
Estimated tonnage per capita landfilled in FY2002-03: 0.748
tons per capita
Using state data: waste
reduction rate compared to FY1991-92 is 45%
Establish a FY2013-14 per
capita waste reduction goal by determining:
FY2013-14 population
projection (146,653) x per capita estimate for that year assuming no further
waste reduction from FY2002-03 (0.748) = projected tons 109,696
FY2013–14 population
projection (146,653) x per capita estimate (0.53) = 77,726
projected goal in tons.
Projected additional
tons to be managed via recycling, reduction,
composting, etc., not
landfilled to meet 61% goal in that year 31,970
Chapter
1
Solid Waste Department Budget for FY2002-01, FY2001-02 and
FY2002-03
Tables 1a through 1d
Table 1a: Summary of Revenues and
Expenditures
Table 1b: Landfill Operations
Expenditures
Table 1c: Administration
Expenditures
Table 1d: Recycling Expenditures*
*This fund
represents the Departmental expenditures on recycling and waste reduction
programs for all programs, salaries, equipment, fuel, repairs, etc. Cost of
solid waste education programs and planning are incorporated into the
administration budget. The overall budget is reorganized into three categories:
administration, landfill operations, and recycling operations.
Solid Waste Managed at Orange County
Landfill 2002-03
Table 1e: Monthly disposal by
type of waste compared to 2001-02
Table 1f: Monthly disposal by
type of customer compared to 2001-02
Table 1g: Monthly revenues
received 2002-03 compared to 2001-02
Table 1h: Monthly
diverted tonnage including: yard waste, tires, white goods, construction
materials, compared to 2001-02
Recycling Tonnage by Program and Material in Orange
County
Table 1i:
Annual tonnage of all materials by all programs operated by Orange Community
Recycling and others within Orange County
Table 1a
|
Solid
Waste/Landfill Operations
|
|
|
Summary
|
|
|
|
2000-01
|
2001-02
|
2002-03
|
2002-03
|
2003-04
|
2003-04
|
|
|
Actual Expenditures
|
Actual Expenditures
|
Original Budget
|
Actual Expenditures
|
Department Requested
|
Commissioner Approved
|
|
By Program (Enterprise Fund)
|
|
|
|
|
|
|
Administration
|
$437,614
|
$458,201
|
$752,723
|
$755,173
|
$956,618
|
$956,618
|
|
Landfill
Operations
|
$2,475,753
|
$2,159,462
|
$3,021,942
|
$3,059,072
|
$2,352,045
|
$2,352,045
|
|
Recycling
Operations
|
$1,735,926
|
$1,917,510
|
$2,468,031
|
$2,069,173
|
$2,177,656
|
$2,177,656
|
|
Total
Expenditures
|
$4,649,293
|
$4,535,173
|
$6,242,696
|
$5,883,418
|
$5,486,319
|
$5,486,319
|
|
Offsetting
Revenue
|
$4,649,293
|
$4,535,173
|
$6,242,696
|
$5,883,418
|
$5,486,319
|
$5,486,319
|
|
County Costs
(net)
|
$0
|
$0
|
$0
|
$0
|
$0
|
$0
|
|
Authorized
F.T.E.
|
30.000
|
34.000
|
38.000
|
38.000
|
38.000
|
38.000
|
|
|
|
|
|
|
|
|
|
|
|
|
|
|
|
|
|
Total
Expenditures
|
$4,649,293
|
$4,535,173
|
$6,242,696
|
$5,883,418
|
$5,486,319
|
$5,486,319
|
|
|
|
|
|
|
|
|
|
|
|
|
|
|
Table 1b
|
Landfill
Operations
|
|
|
|
|
|
|
|
|
|
|
|
|
|
|
|
|
|
2000-01
|
2001-02
|
2002-03
|
2002-03
|
2003-04
|
2003-04
|
2003-04
|
|
|
Actual Expenditures
|
Actual Expenditures
|
Original Budget
|
Actual Expenditures
|
Department Requested
|
Manager Recommended
|
Commissioner Approved
|
|
Fund:
50-Solid Waste/Landfill Operations
|
|
|
|
|
|
|
|
Personnel
Services
|
$740,861
|
$770,038
|
$951,416
|
$968,363
|
$971,744
|
$971,744
|
$971,744
|
|
Operations
|
$589,271
|
$547,272
|
$812,830
|
$750,000
|
$1,272,898
|
$1,252,265
|
$1,252,265
|
|
Capital Outlay
|
$1,145,621
|
$12,337
|
$1,257,696
|
$56,211
|
$77,736
|
$127,736
|
$127,736
|
|
Total
Expenditures
|
$2,475,753
|
$1,329,647
|
$3,021,942
|
$1,787,815
|
$2,322,378
|
$2,351,745
|
$2,351,745
|
|
Offsetting
Revenue
|
$2,475,753
|
$1,329,647
|
$3,021,942
|
$1,787,815
|
$2,322,378
|
$2,351,745
|
$2,351,745
|
|
County Costs
(net)
|
$0
|
$0
|
$0
|
$0
|
$0
|
$0
|
$0
|
|
Authorized
F.T.E.
|
16.000
|
17.000
|
17.000
|
20.000
|
20.000
|
20.000
|
20.000
|
|
|
|
|
|
|
|
|
|
|
Total
Landfill Operations Expenditures
|
$2,475,753
|
$1,329,647
|
$3,021,942
|
$1,787,815
|
$2,322,378
|
$2,351,745
|
$2,351,745
|
Table 1c
|
Solid
Waste Administration
|
|
|
|
|
|
|
|
|
|
|
|
|
|
|
|
|
2000-01
|
2001-02
|
2002-03
|
2002-03
|
2003-04
|
2003-04
|
2003-04
|
|
|
Actual Expenditures
|
Actual Expenditures
|
Original Budget
|
Actual Expenditures
|
Department Requested
|
Manager Recommends
|
Commissioner Approved
|
|
Fund:
50-Solid Waste/Landfill Operations
|
|
|
|
|
|
|
Personnel
Services
|
$313,451
|
$246,698
|
$377,539
|
$385,080
|
$398,153
|
$398,153
|
$398,153
|
|
Operations
|
$122,949
|
$211,323
|
$373,984
|
$356,285
|
$572,905
|
$557,465
|
$557,465
|
|
Capital Outlay
|
$1,214
|
$180
|
$1,200
|
$481
|
$1,000
|
$1,000
|
$1,000
|
|
Total
Expenditures
|
$437,614
|
$458,201
|
$752,723
|
$755,173
|
$972,058
|
$956,618
|
$956,618
|
|
Offsetting
Revenue
|
$437,614
|
$458,201
|
$752,723
|
$755,173
|
$972,058
|
$956,618
|
$956,618
|
|
County Costs
(net)
|
$0
|
$0
|
$0
|
$0
|
$0
|
$0
|
$0
|
|
Authorized
F.T.E.
|
6.000
|
6.000
|
6.000
|
6.000
|
6.000
|
6.000
|
6.000
|
|
|
|
|
|
|
|
|
|
|
Total Solid
Waste Administration Expenditures
|
$437,614
|
$458,201
|
$752,723
|
$755,173
|
$972,058
|
$956,618
|
$956,618
|
Table 1d
|
Recycling
Operations
|
|
|
|
|
|
|
|
|
|
|
|
|
|
|
|
|
|
2000-01
|
2001-02
|
2002-03
|
2002-03
|
2003-04
|
2003-04
|
2003-04
|
|
|
Actual Expenditures
|
Actual Expenditures
|
Original Budget
|
Actual Expenditures
|
Department Requested
|
Manager Recommends
|
Commissioner Approved
|
|
Solid
Waste/Landfill Operations
|
|
|
|
|
|
Department: 863
|
|
Personnel
Services
|
$248,500
|
$251,823
|
$457,308
|
$411,998
|
$535,584
|
$535,584
|
$535,584
|
|
Operations
|
$1,440,511
|
$211,340
|
$1,582,325
|
$1,204,742
|
$1,596,112
|
$1,596,112
|
$1,596,112
|
|
Capital Outlay
|
$47,139
|
$59,708
|
$428,598
|
$238,120
|
$45,960
|
$45,960
|
$45,960
|
|
Total
Expenditures
|
$1,736,150
|
$522,871
|
$2,468,231
|
$1,854,860
|
$2,177,656
|
$2,177,656
|
$2,177,656
|
|
Offsetting
Revenue
|
$1,736,150
|
$522,871
|
$2,468,231
|
$1,854,860
|
$2,177,656
|
$2,177,656
|
$2,177,656
|
|
County Costs
(net)
|
$0
|
$0
|
$8,000
|
$0
|
$0
|
$0
|
$0
|
|
Authorized
F.T.E.
|
6.000
|
7.000
|
7.000
|
12.000
|
12.000
|
12.000
|
12.000
|
|
|
|
|
|
|
|
|
|
|
Total
Recycling Operations Expenditures
|
$1,736,150
|
$522,871
|
$2,468,231
|
$1,854,860
|
$2,177,656
|
$2,177,656
|
$2,177,656
|
|
|
July
|
August
|
September
|
October
|
November
|
December
|
January
|
February
|
March
|
April
|
May
|
June
|
Total/ YTD
|
Ave/Mon
|
|
GARBAGE
TYPE (tons)
|
|
|
|
|
|
|
|
|
|
|
|
|
|
|
|
MSW
|
4,872
|
4,680
|
4,709
|
4,794
|
4,555
|
5,009
|
4,595
|
4,235
|
4,779
|
4,900
|
5,008
|
4,789
|
56,925
|
4,744
|
|
Tipping Fees-$45/ton
|
218,242
|
212,682
|
213,612
|
217,263
|
205,994
|
226,677
|
207,331
|
191,438
|
215,375
|
221,148
|
226,900
|
216,064
|
2,572,728
|
|
|
|
$
44.80
|
$
45.45
|
$45.37
|
$45.32
|
$45.22
|
$
45.25
|
$
45.12
|
$
45.20
|
$
45.07
|
$
45.13
|
$
45.31
|
$
45.12
|
$
45.20
|
$ -
|
|
YTD
|
4872
|
9552
|
14260
|
19055
|
23610
|
28619
|
33214
|
37449
|
42228
|
47128
|
52136
|
56925
|
56925
|
|
|
% of total tonnage
|
58.27%
|
58.46%
|
60.72%
|
68.73%
|
65.87%
|
35.21%
|
22.36%
|
47.72%
|
50.32%
|
56.99%
|
53.25%
|
50.22%
|
47.96%
|
56.34%
|
|
Year ago
|
5,006
|
5,197
|
4,454
|
4,891
|
4,715
|
4,663
|
4,766
|
4,304
|
4,469
|
4,972
|
4,891
|
4,249
|
56,577
|
4,715
|
|
Incr/Decr from last year (monthly)
|
-2.67%
|
-9.95%
|
5.73%
|
-1.97%
|
-3.40%
|
7.41%
|
-3.58%
|
-1.60%
|
6.93%
|
-1.45%
|
2.38%
|
12.71%
|
0.62%
|
0.88%
|
|
|
|
|
|
|
|
|
|
|
|
|
|
|
|
|
|
Construction
& Demolition
|
2,462
|
2,423
|
2,122
|
1,254
|
1,456
|
1,081
|
1,490
|
1,160
|
1,542
|
1,637
|
1,509
|
1,772
|
19,909
|
1,659
|
|
Tipping Fees-$41/ton
|
117,453
|
115,457
|
101,009
|
62,149
|
70,205
|
51,986
|
70,833
|
57,012
|
78,272
|
82,789
|
77,052
|
88,776
|
972,995
|
|
|
Revenue / Ton
|
|
$
47.65
|
$47.59
|
$49.58
|
$
48.21
|
$
48.09
|
$47.54
|
$49.14
|
$50.74
|
$50.56
|
$
1.06
|
$50.11
|
$48.87
|
|
|
YTD
|
2,461.51
|
4,884.66
|
7,007.08
|
8,260.61
|
9,716.95
|
10,798.06
|
12,287.98
|
13,448.20
|
14,990.68
|
16,628.12
|
18,137.14
|
19,908.89
|
19,908.89
|
|
|
% of total tonnage
|
29.44%
|
30.27%
|
27.37%
|
17.97%
|
21.06%
|
7.60%
|
7.25%
|
13.07%
|
16.24%
|
19.04%
|
16.05%
|
18.58%
|
16.77%
|
20.06%
|
|
Year ago
|
2,700
|
3,064
|
2,903
|
2,548
|
2,187
|
2,152
|
1,715
|
1,786
|
1,993
|
2,185
|
2,342
|
2,134
|
27,710
|
|
|
Incr/Decr from last year (monthly)
|
-8.84%
|
-20.92%
|
-26.89%
|
-50.81%
|
-33.41%
|
-49.76%
|
-13.13%
|
-35.02%
|
-22.61%
|
-25.06%
|
-35.56%
|
-16.99%
|
-28.15%
|
-28.25%
|
|
|
|
|
|
|
|
|
|
|
|
|
|
|
|
|
|
Tires
|
94
|
104
|
78
|
98
|
|
|
98
|
73
|
99
|
102
|
114
|
81
|
1,087
|
91
|
|
Tipping Fees
|
-
|
-
|
-
|
-
|
-
|
-
|
32
|
-
|
-
|
98
|
-
|
-
|
-
|
-
|
|
Revenue / Ton
|
-
|
-
|
-
|
-
|
-
|
-
|
$
0.33
|
-
|
-
|
$
0.96
|
$ -
|
$
-
|
$
-
|
|
|
YTD
|
|
|
276
|
374
|
436
|
520
|
618
|
691
|
790
|
892
|
1,006
|
1,087
|
1,087
|
91
|
|
% of total tonnage
|
1.12%
|
1.30%
|
1.01%
|
1.40%
|
0.90%
|
0.59%
|
0.48%
|
0.82%
|
1.04%
|
1.19%
|
1.21%
|
0.85%
|
0.92%
|
1.07%
|
|
Year ago
|
101
|
105
|
108
|
67
|
103
|
69
|
82
|
71
|
70
|
109
|
91
|
106
|
1,083
|
90
|
|
Incr/Decr from last year (monthly)
|
-7.43%
|
-0.93%
|
-27.65%
|
46.73%
|
-39.64%
|
20.57%
|
19.61%
|
3.38%
|
40.42%
|
-6.04%
|
25.28%
|
-23.58%
|
0.41%
|
4.23%
|
|
|
|
|
|
|
|
|
|
|
|
|
|
|
|
|
|
Vegetative Waste/Clean Wood
|
658
|
562
|
589
|
615
|
599
|
7,822
|
14,023
|
3,123
|
2,716
|
1,593
|
2,446
|
2,510
|
37,255
|
3,105
|
|
Tipping Fees
|
12,546
|
11,112
|
11,070
|
11,297
|
11,159
|
133,400
|
228,540
|
53,009
|
46,126
|
29,009
|
41,990
|
43,472
|
632,730
|
|
|
Revenue / Ton
|
$ 19.06
|
$19.77
|
$18.79
|
$18.38
|
$18.64
|
$17.06
|
$16.30
|
$ 16.97
|
$16.98
|
$18.21
|
$17.16
|
$17.32
|
$ 16.98
|
|
|
YTD
|
658
|
1,220
|
1,809
|
2,424
|
3,023
|
10,844
|
24,868
|
27,990
|
30,707
|
32,299
|
34,746
|
37,255
|
632,730
|
|
|
% of total tonnage
|
7.87%
|
7.02%
|
7.60%
|
8.81%
|
8.66%
|
54.99%
|
68.23%
|
35.19%
|
28.60%
|
18.52%
|
26.01%
|
26.32%
|
31.39%
|
27.43%
|
|
Year ago
|
564
|
644
|
561
|
606
|
586
|
367
|
361
|
455
|
499
|
680
|
614
|
530
|
6,465
|
539
|
|
Incr/Decr from last year (monthly)
|
16.77%
|
-12.73%
|
4.99%
|
1.51%
|
2.15%
|
2033.04%
|
3789.04%
|
586.89%
|
444.78%
|
134.10%
|
298.56%
|
373.77%
|
476.27%
|
639.41%
|
|
|
|
|
|
|
|
|
|
|
|
|
|
|
|
|
|
|
|
|
|
|
|
|
|
|
|
|
|
|
|
|
|
Landclearing
& Stumps
|
5
|
14
|
9
|
2
|
16
|
11
|
18
|
13
|
29
|
9
|
3
|
9
|
138
|
11
|
|
Tipping Fees
|
187
|
589
|
377
|
63
|
671
|
435
|
721
|
551
|
1,175
|
387
|
118
|
389
|
5,663
|
|
|
Revenue / Ton
|
$41.00
|
$
41.00
|
$
41.31
|
$41.00
|
$41.00
|
$
41.00
|
$
41.00
|
$41.00
|
$
41.11
|
$41.00
|
$41.00
|
$
41.00
|
$
41.04
|
|
|
YTD
|
5
|
19
|
28
|
30
|
46
|
57
|
74
|
88
|
116
|
126
|
128
|
138
|
|
|
|
% of total tonnage
|
0.05%
|
0.18%
|
0.12%
|
0.02%
|
0.24%
|
0.07%
|
0.09%
|
0.15%
|
0.30%
|
0.11%
|
0.03%
|
0.10%
|
0.12%
|
0.13%
|
|
Year ago
|
3
|
10
|
1
|
-
|
-
|
-
|
-
|
27
|
-
|
-
|
-
|
2
|
42
|
4
|
|
Incr/Decr from last year (monthly)
|
72.08%
|
46.53%
|
1100.00%
|
NA
|
NA
|
NA
|
NA
|
-50.19%
|
NA
|
NA
|
NA
|
332.88%
|
225.40%
|
125.11%
|
|
|
|
|
|
|
|
|
|
|
|
|
|
|
|
|
|
Sludge
|
-
|
-
|
-
|
-
|
-
|
-
|
-
|
1
|
-
|
-
|
-
|
-
|
1
|
0
|
|
Tipping Fees
|
-
|
-
|
-
|
-
|
-
|
|
|
63
|
-
|
-
|
-
|
-
|
63
|
|
|
Revenue / Ton
|
|
|
|
|
|
$-
|
$-
|
$-
|
$-
|
$-
|
|
|
$45.00
|
|
|
YTD
|
|
|
|
|
|
|
-
|
1
|
1
|
1
|
|
|
|
|
|
% of total tonnage
|
0.00%
|
0.00%
|
0.00%
|
0.00%
|
0.00%
|
0.00%
|
0.00%
|
0.02%
|
0.00%
|
0.00%
|
0.00%
|
0.00%
|
0.00%
|
0.00%
|
|
Year ago
|
5
|
9
|
-
|
-
|
8
|
-
|
-
|
-
|
-
|
-
|
-
|
-
|
23
|
|
|
Incr/Decr from last year (monthly)
|
|
|
NA
|
NA
|
NA
|
NA
|
NA
|
NA
|
NA
|
NA
|
NA
|
NA
|
-93.91%
|
0.00%
|
|
|
|
|
|
|
|
|
|
|
|
|
|
|
|
|
|
White Goods
(Segregated)
|
38
|
36
|
36
|
35
|
30
|
31
|
27
|
27
|
32
|
41
|
39
|
35
|
406
|
34
|
|
YTD
|
38
|
74
|
110
|
145
|
175
|
206
|
233
|
260
|
292
|
333
|
371
|
406
|
2,643
|
|
|
% of total tonnage
|
0.45%
|
0.45%
|
0.47%
|
0.50%
|
0.44%
|
0.22%
|
0.13%
|
0.30%
|
0.34%
|
0.47%
|
0.41%
|
0.37%
|
0.34%
|
0.41%
|
|
Year ago
|
34
|
46
|
33
|
42
|
36
|
35
|
38
|
44
|
38
|
44
|
43
|
33
|
467
|
39
|
|
Inc/Decr from last year (monthly)
|
10.66%
|
-22.55%
|
9.58%
|
-16.97%
|
-17.47%
|
-9.54%
|
-30.61%
|
-39.66%
|
-14.60%
|
-7.64%
|
-10.79%
|
7.16%
|
-13.03%
|
-11.87%
|
|
|
|
|
|
|
|
|
|
|
|
|
|
|
|
|
|
Clean Metal
|
74
|
49
|
48
|
46
|
58
|
41
|
51
|
52
|
74
|
72
|
70
|
75
|
710
|
59
|
|
YTD
|
74
|
123
|
171
|
217
|
275
|
317
|
368
|
420
|
493
|
565
|
635
|
|
|
|
|
% of total tonnage
|
0.89%
|
0.61%
|
0.62%
|
0.66%
|
0.84%
|
0.29%
|
0.25%
|
0.59%
|
0.77%
|
0.84%
|
0.74%
|
0.78%
|
0.60%
|
0.71%
|
|
Year Ago
|
52
|
48
|
46
|
50
|
46
|
54
|
41
|
47
|
58
|
70
|
45
|
43
|
600
|
50
|
|
Inc/Decr from last year (monthly)
|
42.40%
|
1.00%
|
4.88%
|
-7.15%
|
26.53%
|
-23.18%
|
24.84%
|
10.98%
|
27.40%
|
2.85%
|
54.34%
|
72.11%
|
18.34%
|
19.75%
|
|
|
|
|
|
|
|
|
|
|
|
|
|
|
|
|
|
Mobile Homes
|
11
|
19
|
19
|
8
|
15
|
4
|
30
|
8
|
-
|
38
|
4
|
30
|
184
|
15
|
|
Tipping Fees
|
450
|
750
|
750
|
300
|
600
|
150
|
1,200
|
300
|
-
|
1,500
|
150
|
1,200
|
7,350
|
|
|
Revenue / Ton
|
$
40.00
|
$
40.00
|
$40.00
|
$40.00
|
$
40.00
|
$
40.00
|
$40.00
|
$40.00
|
$
|
$
40.00
|
$40.00
|
$40.00
|
$440.00
|
|
|
Number
|
3.00
|
4.00
|
3.00
|
2.00
|
4.00
|
1.00
|
7.00
|
2.00
|
|
10.00
|
1.00
|
5.00
|
42.00
|
|
|
YTD
|
11
|
0
|
0
|
0
|
0
|
0
|
0
|
0
|
-
|
0
|
0
|
0
|
0
|
|
|
% of total tonnage
|
|
|
|
|
|
|
|
|
|
|
|
|
|
|
|
Year ago
|
-
|
15
|
4
|
4
|
8
|
8
|
8
|
4
|
8
|
15
|
19
|
8
|
98
|
|
|
Inc/Decr from last year (month)
|
|
|
|
|
|
|
|
|
|
|
|
|
66.66%
|
|
|
|
|
|
|
|
|
|
|
|
|
|
|
|
|
|
|
TOTAL
|
8,360
|
8,005
|
7,754
|
6,976
|
6,915
|
14,224
|
20,552
|
8,875
|
9,497
|
8,598
|
9,404
|
9,535
|
118,697
|
9,891
|
|
Tipping Fees
|
348,878
|
340,590
|
326,817
|
291,072
|
288,630
|
412,649
|
508,657
|
302,373
|
340,948
|
334,931
|
346,210
|
349,901
|
3,558,798
|
-
|
|
Revenue / Ton
|
$41.73
|
$42.55
|
$
42.15
|
$
41.72
|
$
41.74
|
$29.01
|
$
24.75
|
$34.07
|
$
35.90
|
$
38.96
|
$36.81
|
$36.70
|
$29.98
|
$
|
|
YTD
|
8,360
|
16,365
|
24,120
|
31,096
|
38,011
|
52,235
|
72,787
|
81,662
|
91,159
|
99,757
|
109,162
|
118,697
|
118,697
|
9,891
|
|
% of total tonnage
|
100.00%
|
100.00%
|
100.00%
|
100.00%
|
100.00%
|
100.00%
|
100.00%
|
100.00%
|
100.00%
|
100.00%
|
100.00%
|
100.00%
|
100.00%
|
100.00%
|
|
Year ago
|
8,598
|
9,283
|
8,214
|
8,329
|
7,804
|
7,473
|
7,128
|
6,847
|
7,247
|
8,218
|
8,170
|
7,229
|
94,521
|
7,869
|
|
Incr/Decr from last year (monthly)
|
-2.76%
|
-13.76%
|
-5.60%
|
-16.25%
|
-11.39%
|
90.34%
|
188.32%
|
29.62%
|
31.05%
|
4.62%
|
15.11%
|
31.90%
|
25.55%
|
25.71%
|
|
GARBAGE SOURCE (tons)
|
July
|
August
|
September
|
October
|
November
|
December
|
January
|
February
|
March
|
April
|
May
|
June
|
Total/YTD
|
Ave/Mon
|
|
UNC Other (Cust #164,148,764)
|
98
|
51
|
36
|
30
|
42
|
9
|
31
|
57
|
74
|
57
|
43
|
55
|
583
|
|
|
UNC Other YTD
|
98
|
148
|
184
|
215
|
257
|
266
|
297
|
354
|
428
|
485
|
528
|
583
|
|
|
|
% of total tonnage
|
1.17%
|
0.63%
|
0.47%
|
0.44%
|
0.61%
|
0.06%
|
0.15%
|
0.64%
|
0.78%
|
0.67%
|
0.46%
|
0.57%
|
|
0.55%
|
|
Year ago
|
45
|
113
|
54
|
68
|
25
|
41
|
47
|
65
|
66
|
49
|
67
|
67
|
708
|
59
|
|
Incr/Decr from last year (monthly)
|
116.97%
|
-55.14%
|
-32.62%
|
-55.38%
|
67.08%
|
-78.29%
|
-34.86%
|
-12.94%
|
12.33%
|
17.57%
|
-36.05%
|
-18.69%
|
-17.69%
|
-9.17%
|
|
|
|
6.05
|
|
|
|
|
|
|
|
|
|
|
|
|
|
Hospital (Cont.#739,742/Cust#278)
|
4
|
6
|
3
|
2
|
-
|
1
|
5
|
3
|
4
|
6
|
6
|
6
|
45
|
4
|
|
Hospital YTD
|
4
|
10
|
13
|
15
|
15
|
16
|
21
|
24
|
28
|
34
|
40
|
45
|
|
|
|
% of total tonnage
|
0.05%
|
0.07%
|
0.04%
|
0.03%
|
0.00%
|
0.01%
|
0.03%
|
0.03%
|
0.05%
|
0.06%
|
0.07%
|
0.06%
|
|
0.04%
|
|
Year ago
|
17
|
6
|
8
|
4
|
4
|
1
|
7
|
4
|
6
|
8
|
6
|
5
|
77
|
6
|
|
Incr/Decr from last year (monthly)
|
-76.32%
|
-5.62%
|
-59.95%
|
-50.00%
|
|
-6.09%
|
-25.75%
|
-37.27%
|
-29.65%
|
-29.94%
|
-0.95%
|
2.38%
|
-37.74%
|
-26.60%
|
|
|
|
|
|
|
|
|
|
|
|
|
|
|
|
|
|
Total UNC
|
102
|
56
|
39
|
32
|
42
|
10
|
36
|
60
|
78
|
63
|
49
|
60
|
628
|
52
|
|
Total UNC YTD
|
102
|
158
|
197
|
229
|
272
|
282
|
318
|
377
|
456
|
519
|
568
|
628
|
|
|
|
% of total tonnage
|
1.22%
|
0.70%
|
0.51%
|
0.46%
|
0.61%
|
0.07%
|
0.18%
|
0.67%
|
0.83%
|
0.73%
|
0.52%
|
0.63%
|
|
0.59%
|
|
Year ago
|
49
|
119
|
61
|
72
|
29
|
42
|
54
|
70
|
72
|
57
|
74
|
73
|
771
|
64
|
|
Incr/Decr from last year (monthly)
|
107.96%
|
-52.62%
|
-36.05%
|
-55.11%
|
45.69%
|
-76.33%
|
-33.69%
|
-14.44%
|
8.64%
|
11.00%
|
-33.04%
|
-17.10%
|
-18.56%
|
-12.09%
|
|
|
|
|
|
|
|
|
|
|
|
|
|
|
|
|
|
County #107
|
1,178
|
1,171
|
1,151
|
1,139
|
1,159
|
1,994
|
1,624
|
1,282
|
1,755
|
1,348
|
1,350
|
1,346
|
16,497
|
1,375
|
|
County YTD
|
1,178
|
2,349
|
3,500
|
4,639
|
5,799
|
7,793
|
9,417
|
10,698
|
12,453
|
13,801
|
15,151
|
16,497
|
|
|
|
% of total tonnage
|
14.09%
|
14.62%
|
14.84%
|
16.33%
|
16.76%
|
14.02%
|
7.90%
|
14.44%
|
18.48%
|
15.67%
|
14.36%
|
14.12%
|
|
14.64%
|
|
Year ago
|
1,286
|
1,232
|
1,101
|
1,164
|
1,162
|
1,180
|
1,070
|
1,031
|
1,148
|
1,292
|
1,155
|
1,104
|
13,924
|
1,160
|
|
Incr/Decr from last year (monthly)
|
-8.39%
|
-4.97%
|
4.56%
|
-2.07%
|
-0.28%
|
69.02%
|
51.75%
|
24.34%
|
52.91%
|
4.32%
|
5.00%
|
21.92%
|
18.48%
|
18.18%
|
|
|
|
|
|
|
|
|
|
|
|
|
|
|
|
|
|
Carrboro (Cust #142)
|
793
|
704
|
648
|
629
|
578
|
1,156
|
1,550
|
812
|
816
|
782
|
764
|
695
|
9,927
|
827
|
|
Carrboro YTD
|
793
|
1,496
|
2,144
|
2,773
|
3,351
|
4,508
|
6,058
|
6,870
|
7,686
|
8,469
|
9,232
|
9,927
|
|
|
|
% of total tonnage
|
9.48%
|
8.79%
|
8.35%
|
9.02%
|
8.37%
|
8.13%
|
7.54%
|
9.15%
|
8.59%
|
9.10%
|
8.12%
|
7.29%
|
|
8.49%
|
|
Year ago
|
727
|
745
|
591
|
661
|
629
|
611
|
665
|
557
|
572
|
701
|
707
|
624
|
7,790
|
649
|
|
Incr/Decr from last year (monthly)
|
9.01%
|
-5.52%
|
9.65%
|
-4.76%
|
-8.07%
|
89.18%
|
133.05%
|
45.93%
|
42.63%
|
11.61%
|
8.01%
|
11.27%
|
27.44%
|
28.50%
|
|
|
|
|
|
|
|
|
|
|
|
|
|
|
|
|
|
Hillsborough (Cust #143)
|
467
|
460
|
199
|
178
|
173
|
192
|
154
|
141
|
161
|
153
|
246
|
254
|
2,779
|
232
|
|
Hillsborough YTD
|
467
|
928
|
1,127
|
1,305
|
1,478
|
1,670
|
1,824
|
1,965
|
2,126
|
2,279
|
2,525
|
2,779
|
|
|
|
% of total tonnage
|
5.59%
|
5.75%
|
2.57%
|
2.56%
|
2.50%
|
1.35%
|
0.75%
|
1.59%
|
1.70%
|
1.77%
|
2.62%
|
2.67%
|
|
2.62%
|
|
Year ago
|
476
|
488
|
394
|
441
|
419
|
412
|
514
|
395
|
435
|
472
|
475
|
428
|
5,348
|
446
|
|
Incr/Decr from last year (monthly)
|
-1.80%
|
-5.62%
|
-49.43%
|
-59.52%
|
-58.78%
|
-53.38%
|
-70.10%
|
-64.28%
|
-62.95%
|
-67.66%
|
-48.23%
|
-40.57%
|
-48.04%
|
-48.53%
|
|
|
|
|
|
|
|
|
|
|
|
|
|
|
|
|
|
Chapel Hill (Cust
#668.669,2047)
|
2,173
|
1,981
|
2,035
|
2,115
|
1,872
|
3,037
|
6,154
|
2,630
|
3,123
|
2,328
|
2,691
|
2,146
|
32,283
|
2,690
|
|
Chapel Hill YTD
|
2,173
|
4,154
|
6,189
|
8,304
|
10,176
|
13,212
|
19,366
|
21,996
|
25,119
|
27,447
|
30,137
|
32,283
|
|
|
|
% of total tonnage
|
25.99%
|
24.75%
|
26.24%
|
30.31%
|
27.07%
|
21.35%
|
29.94%
|
29.63%
|
32.88%
|
27.08%
|
28.61%
|
22.50%
|
|
27.20%
|
|
Year ago
|
2,087
|
2,149
|
1,833
|
2,047
|
1,865
|
1,844
|
1,973
|
1,722
|
1,815
|
2,125
|
2,069
|
1,751
|
23,281
|
1,940
|
|
Incr/Decr from last year (monthly)
|
4.14%
|
-7.79%
|
11.00%
|
3.31%
|
0.38%
|
64.65%
|
211.94%
|
52.73%
|
72.01%
|
9.53%
|
30.02%
|
22.52%
|
38.67%
|
39.54%
|
|
|
|
|
|
|
|
|
|
|
|
|
|
|
|
|
|
Other
|
3,648
|
3,633
|
3,682
|
2,882
|
3,090
|
7,835
|
11,034
|
3,950
|
3,564
|
3,924
|
4,305
|
5,034
|
56,582
|
4,715
|
|
Other YTD
|
3,648
|
7,281
|
10,963
|
13,845
|
16,936
|
24,770
|
35,805
|
39,755
|
43,319
|
47,243
|
51,548
|
56,582
|
|
|
|
% of total tonnage
|
43.63%
|
45.39%
|
47.49%
|
41.31%
|
44.69%
|
55.08%
|
53.69%
|
44.51%
|
37.53%
|
45.64%
|
45.78%
|
52.79%
|
|
46.46%
|
|
Year ago
|
3,952
|
4,539
|
4,223
|
3,940
|
3,695
|
3,382
|
2,839
|
3,066
|
3,193
|
3,558
|
3,678
|
3,238
|
43,304
|
3,609
|
|
Incr/Decr from last year (monthly)
|
-7.70%
|
-19.96%
|
-12.81%
|
-26.86%
|
-16.37%
|
131.70%
|
288.63%
|
28.84%
|
11.60%
|
10.30%
|
17.06%
|
55.48%
|
30.66%
|
38.33%
|
|
|
|
|
|
|
|
|
|
|
|
|
|
|
|
|
|
Total
|
8,360
|
8,005
|
7,754
|
6,976
|
6,915
|
14,224
|
20,552
|
8,875
|
9,497
|
8,598
|
9,404
|
9,535
|
118,697
|
9,891
|
|
Total YTD
|
8,360
|
16,365
|
24,120
|
31,096
|
38,011
|
52,235
|
72,787
|
81,662
|
91,159
|
99,757
|
109,162
|
118,697
|
|
|
|
% of total tonnage
|
100.00%
|
100.00%
|
100.00%
|
100.00%
|
100.00%
|
100.00%
|
100.00%
|
100.00%
|
100.00%
|
100.00%
|
100.00%
|
100.00%
|
|
100.00%
|
|
Year ago
|
8,598
|
9,283
|
8,214
|
8,329
|
7,804
|
7,473
|
7,128
|
6,847
|
7,247
|
8,218
|
8,170
|
7,229
|
94,540
|
7,878
|
|
Incr/Decr from last year (monthly)
|
-2.76%
|
-13.76%
|
-5.60%
|
-16.25%
|
-11.39%
|
90.34%
|
188.32%
|
29.62%
|
31.05%
|
4.62%
|
15.11%
|
31.90%
|
25.55%
|
28.43%
|
|
COSTS / REVENUES
|
July
|
August
|
September
|
October
|
November
|
December
|
January
|
February
|
March
|
April
|
May
|
June
|
Total/YTD
|
Ave/Mon
|
|
|
|
|
|
|
|
|
|
|
|
|
|
|
|
|
|
Cash
|
42,685
|
37,736
|
36,708
|
25,905
|
31,778
|
23,958
|
27,726
|
23,835
|
34,452
|
54,189
|
54,404
|
51,329
|
444,705
|
37,059
|
|
Cash YTD
|
42,685
|
80,421
|
117,129
|
143,034
|
174,812
|
198,770
|
226,496
|
250,331
|
284,783
|
338,972
|
393,376
|
444,705
|
|
|
|
Tonnage
|
970.36
|
873.86
|
850.10
|
637.11
|
761.11
|
590.07
|
638.40
|
600.89
|
917.20
|
1,372.56
|
1,651.31
|
1,409.57
|
11,272.54
|
939.38
|
|
(Tonnage YTD)
|
970.36
|
1,844.22
|
2,694.32
|
3,331.43
|
4,092.54
|
4,682.61
|
5,321.01
|
5,921.90
|
6,839.10
|
8,211.66
|
9,862.97
|
11,272.54
|
|
|
|
% of Month's Revenue
|
12.23%
|
11.08%
|
11.23%
|
8.90%
|
11.01%
|
5.81%
|
5.45%
|
7.64%
|
10.10%
|
14.97%
|
14.68%
|
13.75%
|
|
10.57%
|
|
Year ago
|
41,988
|
55,029
|
58,391
|
46,427
|
45,633
|
35,754
|
27,589
|
33,186
|
39,348
|
41,354
|
41,596
|
39,387
|
505,681
|
42,140
|
|
Incr/Decr from last year (monthly)
|
1.66%
|
-31.42%
|
-37.13%
|
-44.20%
|
-30.36%
|
-32.99%
|
0.50%
|
-28.18%
|
-12.44%
|
31.04%
|
30.79%
|
30.32%
|
-12.06%
|
-10.20%
|
|
|
|
|
|
|
|
|
|
|
|
|
|
|
|
|
|
Invoice
|
306,193
|
302,854
|
290,109
|
265,167
|
256,852
|
388,691
|
480,931
|
288,222
|
306,496
|
307,793
|
316,249
|
321,979
|
3,831,537
|
319,295
|
|
Invoice YTD
|
306,193
|
609,047
|
899,156
|
1,164,324
|
1,421,176
|
1,809,867
|
2,290,798
|
2,579,020
|
2,885,516
|
3,193,310
|
3,509,559
|
3,831,537
|
|
|
|
(Tonnage)
|
7,389.94
|
7,131.31
|
6,904.16
|
6,339.10
|
6,153.83
|
13,634.16
|
19,913.09
|
8,708.30
|
8,579.97
|
7,492.23
|
8,581.42
|
9,220.95
|
110,048.46
|
9,170.71
|
|
(Tonnage YTD)
|
7,389.94
|
14,521.25
|
21,425.41
|
27,764.51
|
33,918.34
|
47,552.50
|
67,465.59
|
76,173.89
|
84,753.86
|
92,246.09
|
100,827.51
|
110,048.46
|
|
|
|
% of Month's Revenue
|
87.77%
|
88.92%
|
88.77%
|
91.10%
|
88.99%
|
94.19%
|
94.55%
|
92.36%
|
89.90%
|
85.03%
|
85.32%
|
86.25%
|
|
89.43%
|
|
Year ago
|
319,103
|
332,342
|
284,077
|
303,160
|
279,771
|
280,162
|
272,389
|
251,684
|
265,453
|
298,769
|
301,078
|
262,977
|
3,450,964
|
287,580
|
|
Incr/Decr from last year (monthly)
|
-4.05%
|
-8.87%
|
2.12%
|
-12.53%
|
-8.19%
|
38.74%
|
76.56%
|
14.52%
|
15.46%
|
3.02%
|
5.04%
|
22.44%
|
11.03%
|
12.02%
|
|
|
|
|
|
|
|
|
|
|
|
|
|
|
|
|
|
Total Revenue Transacted
|
348,878
|
340,590
|
326,817
|
291,072
|
288,630
|
412,649
|
508,657
|
312,057
|
340,948
|
361,982
|
370,653
|
373,307
|
4,276,242
|
356,354
|
|
Year ago
|
361,091
|
387,371
|
342,467
|
349,587
|
325,404
|
315,916
|
299,978
|
284,871
|
304,801
|
340,123
|
342,674
|
302,364
|
3,956,645
|
329,720
|
|
Incr/Decr from last year (monthly)
|
-3.38%
|
-12.08%
|
-4.57%
|
-16.74%
|
-11.30%
|
30.62%
|
69.56%
|
9.54%
|
11.86%
|
6.43%
|
8.16%
|
23.46%
|
8.08%
|
9.30%
|
|
|
|
|
|
|
|
|
|
|
|
|
|
|
|
|
|
Cost per ton
|
$41.73
|
$42.55
|
$42.15
|
$41.72
|
$41.74
|
$29.01
|
$24.75
|
$33.52
|
$35.90
|
$40.83
|
$36.22
|
$35.12
|
$35.25
|
2.94
|
|
Collections on Account
|
267,300.00
|
254,291.83
|
349,053.82
|
295,017.20
|
215,035.35
|
335,328.41
|
300,937.95
|
346,919.81
|
359,919.56
|
319,254.16
|
291,720.06
|
331,398.72
|
|
|
|
Budgeted Landfill Fee Revenue
|
$3,629,250
|
3,288,659.91
|
2,961,842.43
|
2,670,770.08
|
2,382,139.91
|
1,969,490.81
|
1,460,833.97
|
1,148,776.96
|
807,828.59
|
445,846.15
|
75,192.96
|
(298,114.42)
|
|
$3,629,250.00
|
|
% of budget revenue
|
9.61%
|
9.38%
|
9.01%
|
8.02%
|
7.95%
|
11.37%
|
14.02%
|
8.60%
|
9.39%
|
9.97%
|
10.21%
|
10.29%
|
|
|
|
% YTD
|
9.61%
|
19.00%
|
28.00%
|
36.02%
|
43.98%
|
55.35%
|
69.36%
|
77.96%
|
87.35%
|
97.33%
|
107.54%
|
117.83%
|
|
|
|
Current fee revenue
|
$348,878
|
$689,468
|
$1,016,286
|
$1,307,358
|
$1,595,988
|
$2,008,637
|
$2,517,294
|
$2,829,351
|
$3,170,299
|
$3,532,282
|
$3,902,935
|
$4,276,242
|
|
|
|
Needed to meet budget
|
$3,280,372
|
$2,939,782
|
$2,612,964
|
$2,321,892
|
$2,033,262
|
$1,620,613
|
$1,111,956
|
$799,899
|
$458,951
|
$96,968
|
($273,685)
|
($646,992)
|
|
|
|
|
|
|
|
|
|
|
|
|
|
|
|
|
0.00
|
|
|
Other
RevenuesNot Above
|
|
|
|
|
|
|
|
|
|
|
|
|
|
|
|
|
|
|
|
|
|
|
|
|
|
|
|
|
|
|
|
|
|
|
|
|
|
|
|
|
|
|
|
|
|
|
|
C&D Citations
|
|
|
|
150.00
|
50.00
|
50.00
|
0.00
|
0.00
|
50.00
|
150.00
|
0.00
|
50.00
|
$500.00
|
$750.00
|
|
C&D Permits/Licensing/Certifications
|
|
|
2,550.00
|
5,938.43
|
2,731.34
|
1,484.81
|
3,327.19
|
2,445.24
|
2,545.00
|
2,745.30
|
75.00
|
30.00
|
$23,872.31
|
$53,837.00
|
|
|
|
|
|
|
|
|
|
|
|
|
|
|
|
|
|
D.H. Griffin
|
$203.20
|
|
$1,398.00
|
$1,568.70
|
$547.90
|
$1,317.17
|
$0.00
|
$0.00
|
$0.00
|
$0.00
|
$0.00
|
$0.00
|
$5,034.97
|
|
|
Atlantic Scrap Mixed Metal
|
|
|
|
|
$3,363.60
|
$2,517.00
|
$7,341.55
|
$1,725.10
|
$1,126.05
|
$3,523.00
|
$7,440.65
|
$3,749.20
|
$30,786.15
|
$12,000.00
|
|
Atlantic Scrap White Goods
|
|
|
|
|
|
|
|
$938.00
|
$864.15
|
$1,297.10
|
$868.15
|
$421.75
|
$4,389.15
|
$12,000.00
|
|
TT & E Iron & Metal, Inc.
|
|
|
|
|
|
|
|
|
|
|
|
$2,769.12
|
$2,769.12
|
|
|
Mulch Sales-MO
|
$0.00
|
$0.00
|
$486.00
|
$6,066.00
|
5,166.00
|
$1,548.00
|
$2,322.00
|
$5,126.00
|
$12,618.00
|
$13,466.00
|
$14,634.00
|
$9,166.00
|
$70,598.00
|
$85,000.00
|
|
Red Mulch Sales-RD
|
$0.00
|
$25.00
|
$0.00
|
$75.00
|
50.00
|
$0.00
|
$0.00
|
$0.00
|
$0.00
|
$0.00
|
$0.00
|
$150.00
|
$300.00
|
$75,000.00
|
|
Glass, Plastic, Paper
|
|
|
|
|
|
|
|
|
|
|
|
|
$0.00
|
$73,150.00
|
|
Chatham Salvage
|
|
|
|
|
|
|
|
|
|
|
|
|
|
|
|
Federal Waste Paper
|
|
|
|
|
|
|
$367.50
|
$0.00
|
$0.00
|
$0.00
|
$0.00
|
$0.00
|
$367.50
|
|
|
CRT
|
|
|
$450.00
|
$96.00
|
$0.00
|
$0.00
|
$96.00
|
$12.00
|
$60.00
|
$0.00
|
$1,000.65
|
$198.00
|
$1,912.65
|
|
|
Paperstock Dealer
|
$8,275.82
|
$11,553.91
|
$10,903.04
|
$10,096.73
|
$6,743.16
|
$9,781.07
|
$8,254.88
|
$4,858.82
|
$6,325.82
|
$8,174.22
|
$0.00
|
$7,413.66
|
$92,381.13
|
|
|
Wise Recycling, LLC
|
$3,266.80
|
$0.00
|
$3,307.20
|
$3,584.40
|
$0.00
|
$3,290.82
|
$3,156.80
|
$2,751.60
|
$2,340.80
|
$4,961.60
|
$0.00
|
$3,109.20
|
$29,769.22
|
|
|
Container RCY All
|
$1,313.70
|
$1,297.01
|
$1,198.06
|
$1,063.95
|
$980.39
|
$1,212.85
|
$819.17
|
$0.00
|
$925.55
|
$1,198.73
|
$802.40
|
$1,148.54
|
$11,960.35
|
|
|
Shimar Recycling
|
|
|
|
|
|
|
|
|
|
$42.40
|
$0.00
|
$0.00
|
$42.40
|
|
|
Waste Management RcyAm
|
|
$1,422.80
|
|
$1,431.25
|
|
$1,751.74
|
$831.38
|
$3,035.34
|
$817.70
|
$1,680.45
|
$931.28
|
$1,983.15
|
$13,885.09
|
|
|
J&M Recycling and Consulting
|
|
$199.08
|
$0.00
|
$0.00
|
$0.00
|
$0.00
|
$0.00
|
$0.00
|
$196.74
|
$0.00
|
$0.00
|
$0.00
|
$395.82
|
|
|
Boiler Fuel Sierra Pine LTD
|
|
|
|
|
|
|
|
|
|
|
|
$2,558.80
|
$2,558.80
|
$5,000.00
|
|
Multifamily Revenues
|
|
|
|
|
|
|
|
|
|
|
|
|
$0.00
|
$23,725.00
|
|
Total Budget Recyclables
|
|
|
|
|
|
|
|
|
|
|
|
|
$0.00
|
$125,875.00
|
|
Landfill Fines MLPs
|
$3,556.22
|
$6,393.16
|
$2,895.24
|
$12,741.03
|
$6,275.72
|
$2,502.67
|
$5,366.94
|
$2,528.10
|
$5,061.65
|
$8,739.42
|
$3,879.04
|
$8,944.42
|
$68,883.61
|
$100,000.00
|
|
Tarp Sales
|
$288.00
|
$212.00
|
$216.00
|
$234.00
|
$244.00
|
$116.00
|
$0.00
|
$0.00
|
$8.00
|
$200.00
|
$178.00
|
$244.00
|
$1,940.00
|
|
|
Late Charges
|
$81.88
|
$109.85
|
$100.27
|
$96.84
|
$98.33
|
$103.99
|
$94.05
|
$848.67
|
$1,994.49
|
$2,350.83
|
$2,391.58
|
$2,072.46
|
$10,343.24
|
|
|
White Goods Tax Reimb.
|
$0.00
|
$11,458.29
|
$0.00
|
$0.00
|
$14,140.92
|
$0.00
|
$0.00
|
$10,880.60
|
$0.00
|
$0.00
|
$9866..49
|
$0.00
|
$36,479.81
|
$45,000.00
|
|
White Goods Grant
|
$0.00
|
$0.00
|
$0.00
|
$0.00
|
$0.00
|
$0.00
|
$0.00
|
$0.00
|
$0.00
|
$0.00
|
$0.00
|
$89,708.78
|
$89,708.78
|
|
|
Scrap Tire Grant
|
|
|
|
|
|
|
|
|
|
|
|
|
$0.00
|
|
|
Tire Tax Reimbursement
|
|
$27,735.43
|
$0.00
|
$0.00
|
$31,087.93
|
$0.00
|
$0.00
|
$27,679.32
|
$0.00
|
$0.00
|
$24,030.31
|
$0.00
|
$110,532.99
|
$95,000.00
|
|
Sale Compost
|
$275.00
|
$225.00
|
$500.00
|
$2,500.00
|
$550.00
|
$100.00
|
$75.00
|
$0.00
|
$1,450.00
|
$2,050.00
|
$1,675.00
|
$950.00
|
$10,350.00
|
$40,000.00
|
|
Recycling Grants
|
$2,200.00
|
$0.00
|
$0.00
|
$0.00
|
$0.00
|
$0.00
|
$0.00
|
$0.00
|
$0.00
|
$0.00
|
$0.00
|
$0.00
|
$2,200.00
|
|
|
Interest Income
|
|
|
|
|
|
|
|
|
|
|
|
|
$0.00
|
$130,000.00
|
|
Other Misc. Revenues
|
|
|
|
|
|
|
|
|
|
$500.00
|
$0.00
|
$0.00
|
$500.00
|
$500.00
|
|
Recycling Boxes
|
$84.00
|
$161.00
|
$91.00
|
$49.00
|
$84.00
|
$28.00
|
$0.00
|
$14.00
|
$35.00
|
$42.00
|
$35.00
|
$98.00
|
$721.00
|
|
|
Returned Check Fee
|
|
$25.00
|
$0.00
|
$0.00
|
$0.00
|
$0.00
|
$0.00
|
$0.00
|
$0.00
|
$0.00
|
$0.00
|
$0.00
|
$25.00
|
|
|
TOTAL - Other Revenues
|
$19,544.62
|
$60,631.53
|
$21,453.81
|
$39,553.90
|
$69,247.95
|
$24,241.31
|
$28,725.27
|
$60,383.55
|
$33,788.95
|
$48,183.75
|
$57,831.06
|
$134,587.08
|
$598,088.78
|
$4,380,212.00
|
|
Total Landfill
Revenues
|
$368,422.69
|
$401,221.62
|
$348,271.29
|
$330,626.25
|
$357,878.12
|
$436,890.41
|
$537,382.11
|
$372,440.56
|
$374,737.32
|
$410,166.19
|
$428,484.25
|
$507,894.46
|
$4,874,415.27
|
|
|
|
|
|
|
|
|
|
|
|
|
|
|
|
|
|
Materials Diverted from Landfill (shaded areas)
|
|
1992-93
|
1993-94
|
1994-95
|
1995-96
|
1996-97
|
1997-98
|
1998-99
|
1999-00
|
2000-2001
|
2001-02
|
02-03YTD
|
02-03 Budget/Tons
|
|
|
|
MSW
|
63,422
|
65,149
|
61,059
|
57,889
|
58,590
|
57,800
|
59,990
|
62,404
|
58,955
|
56,577
|
56,925.03
|
56,500.00
|
|
|
|
C&D
|
34,502
|
26,771
|
32,287
|
31,207
|
33,858
|
29,700
|
33,577
|
30,514
|
33,471
|
27,710
|
19,908.89
|
19,900.00
|
|
|
|
Vegetative
Waste
|
2,304
|
3,925
|
4,231
|
4,917
|
33,577
|
6,500
|
6,535
|
6,847
|
6,927
|
6,465
|
37,255.43
|
40,000.00
|
|
|
|
Tires
|
267
|
755
|
1,515
|
916
|
1,055
|
1,079
|
1,108
|
1,232
|
1,237
|
1,083
|
1087..34
|
|
|
|
|
Stumps
|
|
310
|
654
|
135
|
3,970
|
189
|
90
|
62
|
78
|
42
|
137.97
|
|
|
|
|
Sludge
|
29
|
|
284
|
72
|
89
|
3
|
305
|
59
|
74
|
23
|
1.39
|
|
|
|
|
White
Goods
|
|
|
231
|
337
|
424
|
431
|
494
|
447
|
416
|
467
|
406.24
|
|
|
|
|
Clean
Metal
|
0
|
0
|
0
|
0
|
0
|
0
|
0
|
11
|
241
|
600
|
709.86
|
|
|
|
|
Recycling
Waste
|
0
|
0
|
0
|
0
|
0
|
0
|
0
|
988
|
1,342
|
1,456
|
2,080.63
|
|
|
|
|
Mobile
Homes
|
0
|
0
|
0
|
0
|
0
|
0
|
0
|
56
|
94
|
98
|
183.75
|
|
|
|
|
TOTALBudTon
|
100,227
|
95,844
|
97,577
|
94,013
|
126,025
|
94,000
|
100,102
|
99,765
|
99,353
|
94,520.52
|
117,609
|
116,400
|
|
|
|
|
|
|
|
|
|
|
|
|
|
|
|
|
|
|
|
|
|
|
|
|
|
|
|
|
|
|
|
|
|
|
|
|
|
|
|
|
|
|
|
|
|
|
|
|
|
|
|
|
|
|
|
|
|
|
|
|
|
|
|
|
|
|
|
|
|
|
|
|
|
|
|
|
|
|
|
|
|
|
|
|
|
|
|
|
|
|
|
|
|
|
|
|
|
|
|
|
|
|
|
|
|
|
|
|
|
|
|
|
|
|
|
|
|
|
|
|
|
|
|
|
|
|
|
|
|
|
|
|
|
|
|
|
|
|
|
|
|
|
|
|
|
|
|
|
|
|
|
|
|
Table
1i
|
Orange County Recycling Collection By Program and Material Type
FY2002-03
|
|
|
Dropoff/Comm/MFU
|
MFU Contractor
|
Curb
|
Total
|
|
Plastics
|
158
|
32
|
292
|
482
|
|
Glass
|
1,236
|
236
|
1,165
|
2,637
|
|
Metal Cans
|
|
|
|
|
|
AL
|
37
|
8
|
44
|
89
|
|
Steel
|
114
|
25
|
134
|
273
|
|
News
|
1,857
|
261
|
2,882
|
5,000
|
|
Mags
|
318
|
|
|
318
|
|
OCC
|
1,155
|
|
|
1,155
|
|
Mixed
|
1,024
|
|
|
1,024
|
|
Food Waste
|
811
|
|
|
811
|
|
Electronics
|
30
|
|
|
30
|
|
Dry-cell
|
3
|
|
|
3
|
|
Lead Acid
|
67
|
|
|
67
|
|
HHW (by contractor)
|
80
|
|
|
80
|
|
Paint (OC)
|
4
|
|
|
4
|
|
Oil
|
109
|
|
|
109
|
|
Oil Filters
|
8
|
|
|
8
|
|
Wood Chips
|
1,368
|
|
|
1,368
|
|
Scrap Metal
|
710
|
|
|
710
|
|
Totals
|
9,089
|
562
|
4,516
|
14,168
|
Chapter
2
Solid Waste Management Activity Summary 2000-2003
A summary of solid waste
management activities undertaken in the past three years, specifically by the
Orange County Solid Waste Management Department. Table 2a
Where an individual jurisdiction has
taken the lead on a particular issue, that is noted in Table 2b. Additional
details are provided in Appendix G for each Town.
e.g. Town of Chapel Hill
converted its residential collection from backyard manual to semi-automated
curbside in FY2001-02
Remainder of this page intentionally blank
Table 2a Summary of Work led by Orange County
Solid Waste Dept.
July 2000 -- June 2003
|
Date
|
Landfill Operation
|
Landfill Siting, design,
permitting and study
|
Waste Reduction &
Recycling Operations
|
Waste Reduction
Study
|
|
2000-01
|
Financed construction of
water line for Rogers Road neighborhood.
|
Initiated Solid Waste
Advisory Board.
Began study of alt.
Landfill cap design using only soil, not liner. Potential to save $1.1
million Actively began seeking markets for landfill gas.
|
Built covered area for
recycling processing area.
|
Began consideration of
regulating C&D wastes to extend life of C&D landfill.
|
|
2001-02
|
Construction of water line
completed.
|
Begin consideration of
wildlife habitat enhancement at closed landfill.
|
Passed Regulated Recyclable
Materials Ordinance (RRMO). New recycling drop off site.
|
|
|
2002-03
|
Constructed C&D
recycling area for wood, scrap metal and mulch sales. Purchased industrial
waste wood grinder to handle yard waste & C&D. Ground 36,000 tons of
wood due to ice storm. Began sales of red mulch & boiler fuel made from
C&D wood.
Purchase tractor and
trailer to haul wood, metal, mulch and other recyclables.
|
Condemned land for new 14
acre C&D landfill adjoining current landfill site and began permitting
process. Began consideration of sewer line for transferring leachate to
WWTP. Instead of pump and haul as we now do.
|
Implemented and enforced
RRMO banning disposal of OCC, scrap metal & clean wood waste along with
licensing of haulers and requiring solid waste plan from permittees. Promoted
deconstruction throughout county. Took over MFU recycling from contractor.
Switched HHW to 4 days/week. Permanent electronics collection began at new
facility. New recycling drop-off site.
|
Began study of solid waste
financing alternatives. Presented fee and tax funding options to BOCC.
|
Table 2b Work on Solid
Waste by Individual jurisdictions.
|
Date
|
Town of Carrboro
|
Town of Chapel Hill
|
Town of Hillsborough
|
Orange County
Sanitation (Public Works Dept.)
|
|
2000-01
|
|
|
Converted residential
collection to fully automated for 90% of households.
|
|
|
2001-02
|
|
Converted residential waste
collection to semi-automated once-a-week cart collection from 2x/week
backyard. Reduced collection labor 50% & allowed for schedule brush
collection.
Converted commercial
collection to fee for service for 1-5x week from 2x/week 'free'. Converted
multifamily to one free collection weekly from 2x. Reduced commercial.
Collection labor 20%.
|
Bid out commercial waste
collection for all non-single family residential units, instead of public
collection. Collection now privately funded and exclusively franchised.
|
|
|
2002-03
|
Initiated unit based
pricing for commercial waste collection. Oct. 2002 50% of customers opted
out. Did not include multifamily that's still tax based and 2x/week.
|
|
Waste Industries begins
commercial waste hauling from Hillsborough, August 2002.
|
Began separate collection
of clean wood and scrap metal at SWCC's to comply with County ban on
landfilling these materials. Electronics, oil filters and batteries at
SWCCs. Installed roll-off containers at Hwy 57 and High Rock Road
for clean wood, yard waste, and C&D.
|
Chapter
3
Solid Waste
Planning Update
Planning
In this section, we will
follow the outline shown in the guidance document. Thus we will start with the
general planning guidelines in this chapter. Appendix F contains the planning
elements listed element-by-element with source reduction etc, review of the
work by the Solid Waste Management Department on each plan element, and include
a recommendation for the coming fiscal year and, in some cases, years beyond.
Orange
County's long term solid waste planning process established a waste reduction
goal of 61% per capita consistent with its goals of environmental protection,
conservation of landfill space and creating a technically achievable goal based
on the contents of the waste stream and ability to divert recyclable
materials. While implementation of the plan to achieve that goal has been
delayed until later into the ten-year planning period, the County's progress
towards the goal has remained steady. In FY2001-02, we exceeded the State's 40%
recycling rate and in FY2002-03 increased our rate to 45%. MSW generation
rates remain steady while population increases. NOTE: State
demographics show a reduction in population in Orange County from
120,952 in June 2001 to 119,746 in June 2002. This is incorrect, population did
not decline but grew. However,119,746 is the divisor that the State has
declared must be used to calculate waste reduction.
In response to the County's
regulated recyclable materials ordinance and development of a recycling
processing area for wood, metal and cardboard, construction waste that
originated in Orange County and was landfilled has fallen 23% since FY2001-02.
Other recycling programs have
experienced incremental improvements in efficiency and amounts collected (in
some cases). As is shown in the public education section and recycling elements
in Appendix F, the County strives for continual program improvement under
current guidelines. Until further revisions to the long-term plan, Orange County will
continue its incremental program growth to accommodate population growth and
modest increased demand for services in rural areas adjoining those being
served.
Evaluation of Program
Performance
Overall evaluation of program
performance is conducted in an ongoing manner in relation to the 61% overall
waste reduction goal as well as the annual internal Departmental goals for
safety, recycling rates in various programs, number and type of education and
outreach efforts, landfill operation, etc. Program goals are adjusted according
to performance feedback e.g. pounds of recyclables collected per household,
tons of food waste collected from restaurants and areas for improvement
targeted accordingly.
Program goals are established
each year as part of the budgeting process and performance compared with the
previous years. (see Appendix H Departmental Goals) The table below was
prepared to illustrate two or three-year performance in some recycling
programs. The data are useful overall and as a rough measure of performance but
individual program tonnages vary up and down from year to year may differ as a
single contractor allocated weights differently among urban curbside, rural
curbside and multifamily recycling.
Table 3a Recycling
Collections for selected programs in Orange County FY2000-01 through FY2002-03
|
Program
|
2000-01
|
2001-02
|
2002-03
|
|
Tons Collected
|
Average Tons/Unit Served
|
Tons Collected
|
Average Tons/Unit served
|
Tons Collected
|
Average Tons/Unit
Served
|
|
Urban Curbside
|
3,350
|
0.22
|
3,302***
|
0.21
|
3,315
|
0.20
|
|
Rural Curbside
|
445
|
0.05
|
1,056***
|
0.12
|
1,201
|
0.13
|
|
MultiFamily
|
1,140
|
|
919***
|
|
(561+516)*
1,077
|
0.09
|
|
DropOff/
Commercial
|
5,331
|
0.045**
|
5,318
|
0.044**
|
5,004
|
0.042**
|
|
Food Waste
|
669
|
48
|
752
|
50
|
811
|
45
|
|
Total
|
10,935
|
|
11,347
|
|
11,408
|
|
* Half year by contractor, half by in-house
Population in each year: 2000-01 <> 2001-02 <> 2002-03
** divided by Orange County pop: 118,237 <> 120,433 <> 119,746
*** reaudit of tonnage distribution among programs in
2001-02
We have also made continuous
improvements in the participation and cost of the hazardous household waste
collection program. The most dramatic change came near the end of FY2002-03
with the conversion of the program from one Saturday per month to a permanent
program operated four days a week. The table below summarizes some of the
improvements in cost per person, amount collected and participation.
Table 3b Orange County
Household Hazardous Waste Program Performance
|
Household Hazardous Waste
Program Cost Analysis FY 2001-02 v. 2002-03.
|
|
|
Annual Totals
|
|
|
# Customers
|
Waste Handled
by Contractor
|
Cost
|
Cost/lb
|
Cost/Customer
|
|
FY 2001-2002
|
2,200
|
108,188
|
$ 123,458
|
$ 1.14
|
$ 56.12
|
|
FY 2002-2003
|
2,868
|
159,009
|
$ 119,885
|
$ 0.75
|
$ 41.80
|
|
|
|
|
|
|
|
|
FY 0102 v FY 0203
|
|
|
|
|
|
% increase in waste
handled in 0203=
|
|
|
|
|
|
% increased participation
in 0203 =
|
30.4%
|
|
|
|
|
% decrease in Cost from
0102 =
|
-2.9%
|
|
|
|
|
% decrease cost/household
from 0102 =
|
-25.5%
|
|
|
|
|
% decrease in cost/pound
from 0102 =
|
-33.9%
|
|
|
|
Table 3c Other Hazardous
Wastes
2000-01 2001-02
2002-03
|
Motor oil
|
107
|
122.2
|
108.5
|
|
Oil Filters
|
7.3
|
7.7
|
8.2
|
|
Batteries
|
52
|
43.7 (wet) + 1(dry)
|
67.2 (wet) + 3.2 (dry)
|
|
Electronics
|
NA
|
16.7
|
30
|
Financing
Departmental operations are
now financed 90% by landfill fees and ten percent by other revenues, see Table
1a. The County plans to add needed supplemental financing through levying an
availability fee or tax increase as current income will not permit us to
continue the current level of operation past June 2004.
For the past two years, we
have worked with the UNC School of Government's Center for Environmental
Finance to develop financial models that will meet the County's solid waste
fiscal needs. The financial model takes into account various capital and
operational needs over the ten-year period. (A draft of the model results is
attached as Appendix I, supporting documentation) Future proposed funding is
from the current sources of landfill tipping fees, recycling and mulch sales
revenue, reimbursements from the State for white goods and tire management, and
other sources as well as the proposed availability fee or, alternatively a tax
increase earmarked to fund solid waste programs.
The model was reviewed by the
Solid Waste Advisory Board in spring 2003 and used by them as a basis for
endorsing a three-part availability fee and the overall waste reduction plan in
a report they made to the BOCC at that time. The proposed fee structure
included a universal services fee to be paid equally by all dwelling units and
non-residential improved properties, a program-based availability fee tied to
the particular recycling program offered to each sector and a prepaid landfill
tipping fee based on estimated weight generated by each sector. The landfill
tipping fees at the gate would have been eliminated under this proposal.
While the BOCC has not
explicitly endorsed any fee and has changed the plan, they do support
continuing at least the current level of waste reduction efforts and the
concept of providing long term stable financing for that effort. As such, the
BOCC will consider a two-part availability fee which provides financing for
universal residential recycling services such as hazardous waste, drop-off
sites and education services through a universal service fee levied equally on
all improved properties. A second part of the fee could be levied at different
rates to finance particular recycling services in each sector - urban curbside,
rural curbside and multifamily recycling. Units receiving no particular service
from the County would not be subject to this second fee. It is anticipated a
decision will be made contingent with the
FY04-05 budget process.
During winter 2004 the
financial model and specific fees will again be presented to the BOCC for
decision-making on how to best implement the supplemental financing. This
information was initially made public using the 2003 issue of Waste Matters,
local newspaper columns and meetings with the Chamber of Commerce. Further
information will be provided to the public throughout the spring of 2004.
Disposal Options and
Intergovernmental Cooperation
The County is committed to
maximizing use of its current disposal sites by recycling as much as possible,
using alternate daily cover, high compaction rates and other available
technologies. Once the current MSW landfill is full, projected in 2009, the
County will build a transfer station and send waste to another location. As
part of the Triangle J Council of Governments, Orange County is now
participating in a multicounty search for a publicly owned regional landfill
site. Because the projected fill date is 2009, the County has not begun the
transfer station siting, design and construction process nor has it begun
negotiating for new landfill space.
While each individual
jurisdiction remains responsible for collection of solid waste, brush and bulky
items, there is ongoing collaboration with the solid waste department on
operational decisions such as access to the landfill during special events such
as ice storms and other feedback such as where recycling program participation
needs boosting. The high level of communication and cooperation, which has been
a hallmark of program success in Orange County, will continue.
Chapter
4
Process for Development of the Plan
Plan development was initiated in 1997 and finalized in
2000 with adoption and reconfirmation of a solid waste reduction goal and a
plan to achieve the goal. During the past year, the County Board has reviewed
the original plan and determined that it wishes to retain the goal but
reconsider the timetable and means for achieving that goal.
As expected in the 2000 update, Orange County has taken
the lead in re-examining the adopted plan now that they are the lead government
in solid waste management The Solid Waste Advisory Board appointed by the BOCC
and the Towns has provided review and recommendations on various solid waste
management issues. While the Solid Waste Advisory Board supported the initial
plan calling for development of a Materials Recovery Facility and universal
recycling collections, the BOCC has not decided to endorse that approach at
this time. Instead, they have endorsed an approach that incrementally expands
the recycling program to accommodate growth in existing programs, but does not
further expand either the type of materials collected or the sectors from which
it is collected. Plans to develop a materials recovery facility have been
suspended and may be reconsidered in the future.
The long-term goal for waste reduction remains the same at
61% per capita; the timetable for reaching that goal is within the ten-year
planning period ending in 2014. As of this year, Orange County has continued
its progress by reaching a waste reduction rate of 45%. We will likely submit
another follow-up report next fiscal year that contains greater detail about
our plans for fiscal stability, facility siting and long-term waste
reduction/recycling efforts.
Our plan development process included the following steps:
·
Submittal of the draft plan to the Solid Waste Advisory Board and
then to the Board of Orange County Commissioners via County’s Manager’s office
from the Solid Waste Management Department. Following submittal to the BOCC,
the Department will also submit this report to the three municipal governments
outlining the process and timeline for commenting and finalization of the
report.
·
Completion of the draft report, internal review and elected
official review from each of the four governing bodies.
·
Issuance of the draft for public comment.
·
Holding a public hearing with attendant publicity and education
on behalf of all four local governments. It is possible each of the governments
may hold its own public hearing or public information meeting on the plan in
addition to the planned formal public hearing to be scheduled by the County.
·
Collecting public comment, integrating it into the report.
·
Getting resolutions from the local governments adopting the
report.
·
Submitting the report to the State.
The following memoranda will be sent out to enlist
cooperation of the local governments in completing this report.
Memorandum
To: Town Managers
From: Gayle
Wilson, Orange County Solid
Waste Management Director
Subject: Update of Ten Year Solid Waste Management
Plan
Date:
We are required by statute
every three years to update our state solid waste management plan. The County,
through the Solid Waste Management Department, has taken the lead in
development and submittal of this report. We are late as the submittal was due
in June 2003. We need help from each of the local governments in the county to
gain Town and citizen input and prepare as thorough, comprehensive and useful
an update as possible
We view this update as not
simply a state requirement, but a real opportunity to reaffirm our County’s
aggressive waste reduction goals, chart our progress towards those goals and
place in front of the public a view of the challenges we face to get there.
Given the pressure we are all under to resolve our solid waste management
financing issues and the ongoing large public investment, the original plan
plus the updates provide us with internal guidance and a roadmap of our own for
achieving our waste reduction goals and establishing the facilities and
financing we need to do that.
This report represents a
change in thinking that reflects both the County's profound progress towards
the goal and a recognition of the constraints presented by the current fiscal
climate. The Board of County Commissioners is recommending that the long-term
goal of 61% waste reduction be retained, but the original means for reaching
that goal as put forth in the 1997 and 2000 versions of the report, be
changed. The recommendation is to delay any major expansions of recycling
collection programs and suspend the concept of constructing a materials
recovery facility to handle mixed loads of recyclables. Instead, the BOCC is
recommending that the recycling programs be maintained at their current levels
and expanded to meet natural growth in housing and population. The goal is
still to be achieved within the ten year planning horizon of this report, that
is by 2014.
The Board is considering
alternative means of financing solid waste management operations, including the
recycling program, as the current landfill tipping fee revenues no longer are
sufficient to finance the existing programs or any of the initially planned
recycling expansions. Over the next several months, the BOCC will develop a
more formal approach to financing that may include either an availability fee
or some type of property tax increase to provide supplemental financing. As
projected, such a fee or tax would become effective in FY2004-05 . The
magnitude and scope of the fee or tax will be calculated in February 2004 and
the Board will proceed from that point.
We have completed the draft
of the plan update document and are submitting it to the Board of Commissioners
for review January 26, 2004. In order to complete the draft report, hold a public
hearing, incorporate public comments and submit our report to the local
governments for final adoption, we request that you consider your meeting
schedule for including this report and, if you choose, establishing additional
public meetings on the solid waste plan. The plan was due June 30, 2003 but we
hope to now submit it in March 2004.
Your staff has already assisted by helping complete the
report data required from the municipalities. We expect the draft report to
come to you for your consideration in early February. The BOCC projects
holding a public hearing at its February 17 meeting. Only one public hearing is
required as part of the plan preparation.
Please contact me at 968-2885
or by email as soon as possible after reviewing this memorandum and timetable
and let me know your ability to get this report on the Town Council or Board of
Aldermen's agenda.
Potential timetable
follows for development of the report:
January 9: Review by Solid Waste Advisory Board
January 26: Review of report by Board of Orange County
Commissioners and establishment of date for public hearing.
Following January 26: Circulation of revised report to three Towns and
establishment of dates for presentation to elected boards.
Following presentations to
Boards: Additional public information
meetings may be scheduled by individual Towns (NOTE: the County will hold the
one required public meeting on the plan February 17.)
Following public hearing: Resolutions sent to the four elected boards adopting
the three-year update.
Following passage of the
four resolutions: Submittal to the
State of North Carolina.
Appendix A
Resolutions
supporting the plan from each jurisdiction
These will be available
after each government reviews plan and holds public hearing
Appendix B
Notification of
Public Hearing(s)
Published In News of Orange 2/11/04 and
Chapel Hill News 2/11/04
Appendix C Location
of Disposal Sites
Map of Disposal
Sites used by local governments in plan
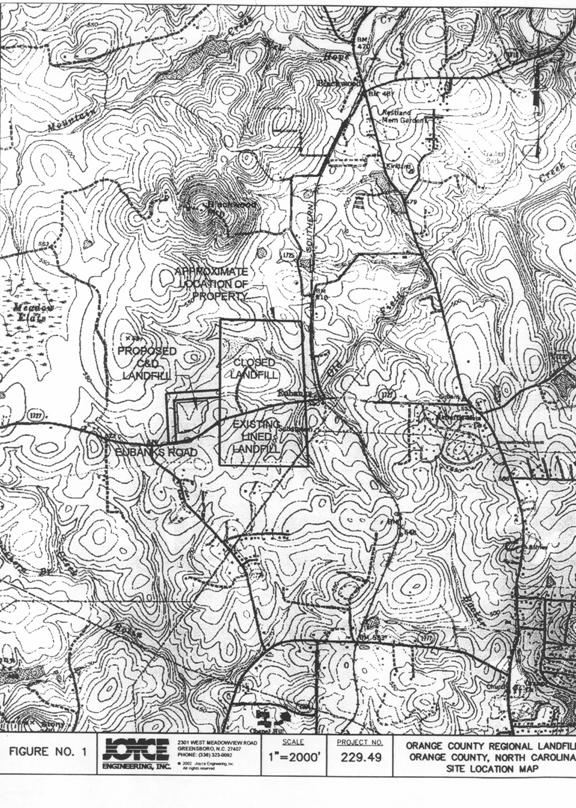
Appendix D
EXHIBIT 4-1
ORANGE
COUNTY WASTE CHARACTERIZATION STUDY
COMPARISON
OF COMMERCIAL WASTE COMPOSITION – 1995 VS. 20001
|
Material Components
|
Mean Composition 1995
|
Mean Composition 2000
|
|
|
|
|
|
|
Paper
|
|
|
|
|
|
Newspaper/Print
|
6.1%
|
4.7%
|
|
|
Glossy Magazines
|
2.8%
|
2.5%
|
|
|
Recyclable Corrugated Cardboard
|
10.7%
|
3.5%
|
|
|
Non-Recyclable Corrugated Cardboard
|
N/A
|
1.8%
|
|
|
Phone Books
|
N/A
|
<0.1%
|
|
|
Coated Containers
|
0.7%
|
1.5%
|
|
|
Paperboard
|
N/A
|
3.5%
|
|
|
Hard Back Books
|
N/A
|
0.8%
|
|
|
Other Books
|
N/A
|
1.1%
|
|
|
White Ledger
|
N/A
|
2.6%
|
|
|
Mixed Office Paper
|
3.3%
|
3.2%
|
|
|
Other paper
|
24.4%
|
7.9%
|
|
|
Total Paper
|
48.0%
|
33.1%
|
|
Plastics
|
|
|
|
|
|
PET Bottles (#1)
|
1.0%
|
2.0%
|
|
|
HDPE Bottles (#2)
|
1.2%
|
1.4%
|
|
|
Film
|
4.8%
|
7.8%
|
|
|
PVC (#3)
|
0.2%
|
0.6%
|
|
|
Expanded Polystyrene (#6)
|
N/A
|
1.8%
|
|
|
All Rigid Containers
|
0.8%
|
2.9%
|
|
|
All Other Plastics
|
6.0%
|
2.0%
|
|
|
Total Plastics
|
14.0%
|
18.5%
|
|
Organics
|
|
|
|
|
|
Food Waste
|
12.2%
|
20.4%
|
|
|
Textiles/Leather
|
2.7%
|
5.0%
|
|
|
Rubber
|
N/A
|
1.0%
|
|
|
Diapers
|
1.4%
|
2.1%
|
|
|
Other Organics
|
4.5%
|
3.2%
|
|
|
Total Organics
|
20.8%
|
31.7%
|
|
Ferrous Metal
|
|
|
|
|
|
Food Containers/Bi-metal
|
1.6%
|
1.2%
|
|
|
Aerosols
|
N/A
|
0.5%
|
|
|
White/Enameled
|
N/A
|
<0.1%
|
|
|
Auto Parts
|
N/A
|
<0.1%
|
|
|
Other Ferrous
|
3.2%
|
1.6%
|
|
|
Total Ferrous Metal
|
4.8%
|
3.3%
|
|
Non Ferrous Metal
|
|
|
|
|
|
Aluminium Cans
|
0.7%
|
1.2%
|
|
|
Aluminium Foil
|
N/A
|
0.8%
|
|
|
Other Non-Ferrous
|
N/A
|
0.2%
|
|
|
Total Non Ferrous
Metal
|
0.7%
|
2.2%
|
EXHIBIT 4-1 (continued)
ORANGE COUNTY WASTE CHARACTERIZATION STUDY
COMPARISON OF COMMERCIAL WASTE
COMPOSITION – 1995 VS. 20001
|
Material Components
|
Mean Composition 1995
|
Mean Composition 2000
|
|
|
|
|
|
|
Glass
|
|
|
|
|
|
Bottles & Jars
|
4.0%
|
N/A
|
|
|
Container Glass-Clear
|
N/A
|
2.0%
|
|
|
Container Glass-Green
|
N/A
|
0.7%
|
|
|
Container Glass-Brown
|
N/A
|
1.1%
|
|
|
Other Glass
|
0.4%
|
0.8%
|
|
|
Total Glass
|
4.2%
|
4.6%
|
|
Wood
|
|
|
|
|
|
Pallets
|
N/A
|
0.5%
|
|
|
Lumber
|
1.6%
|
1.7%
|
|
|
Painted/Treated
|
1.2%
|
0.3%
|
|
|
Stumps/Heavy Sections
|
N/A
|
<0.1%
|
|
|
Total Wood
|
2.8%
|
2.5%
|
|
Inert
|
|
|
|
|
|
Asphalt
|
N/A
|
<0.1%
|
|
|
Concrete/Brick/Rock
|
N/A
|
0.2%
|
|
|
Dirt
|
N/A
|
0.6%
|
|
|
Other Inert
|
N/A
|
0.6%
|
|
|
Total Inert
|
1.4%
|
1.4%
|
|
|
|
|
|
|
Yard Waste
|
|
0.8%
|
1.3%
|
|
|
|
|
|
|
Special Waste
|
|
|
|
|
|
Lead Acid Batteries
|
N/A
|
<0.1%
|
|
|
Dry Cell Batteries
|
N/A
|
0.2%
|
|
|
Oil Filters
|
N/A
|
<0.1%
|
|
|
Other Hazardous Waste
|
1.5%
|
<0.1%
|
|
|
Infectious Waste
|
0.7%
|
N/A
|
|
|
Reusable Waste
|
N/A
|
<0.1%
|
|
|
Total Special Waste
|
2.2%
|
0.2%
|
|
|
|
|
|
|
Brown Goods
|
|
|
|
|
|
Electronic Goods
|
N/A
|
0.6%
|
|
|
|
|
|
|
TOTALS
|
|
100%
|
100.0%
|
|
|
|
|
|
NOTES: 1. Individual numbers may not total exactly, due to
rounding
EXHIBIT 4-2
ORANGE COUNTY WASTE CHARACTERIZATION STUDY
COMPARISON OF RESIDENTIAL WASTE
COMPOSITION – 1995 VS. 20001
|
Material Components
|
Mean Composition 1995
|
Mean Composition 2000
|
|
|
|
|
|
|
Paper
|
|
|
|
|
|
Newspaper/Print
|
5.3%
|
4.8%
|
|
|
Glossy Magazines
|
6.1%
|
4.4%
|
|
|
Recyclable Corrugated Cardboard
|
4.5%
|
4.7%
|
|
|
Non-Recyclable Corrugated Cardboard
|
N/A
|
1.2%
|
|
|
Phone Books
|
N/A
|
0.3%
|
|
|
Coated Containers
|
0.7%
|
1.5%
|
|
|
Paperboard
|
N/A
|
5.1%
|
|
|
Hard Back Books
|
N/A
|
0.2%
|
|
|
Other Books
|
N/A
|
0.2%
|
|
|
White Ledger
|
N/A
|
2.0%
|
|
|
Mixed Office Paper
|
1.7%
|
4.5%
|
|
|
Other paper
|
23.9%
|
7.6%
|
|
|
Total Paper
|
42.2%
|
36.5%
|
|
Plastics
|
|
|
|
|
|
PET Bottles (#1)
|
1.3%
|
1.6%
|
|
|
HDPE Bottles (#2)
|
1.3%
|
1.3%
|
|
|
Film
|
4.3%
|
5.7%
|
|
|
PVC (#3)
|
0.5%
|
0.2%
|
|
|
Expanded Polystyrene (#6)
|
N/A
|
1.4%
|
|
|
All Rigid Containers
|
0.7%
|
2.7%
|
|
|
All Other Plastics
|
3.9%
|
3.0%
|
|
|
Total Plastics
|
12.0%
|
15.9%
|
|
Organics
|
|
|
|
|
|
Food Waste
|
11.2%
|
17.8%
|
|
|
Textiles/Leather
|
3.3%
|
5.4%
|
|
|
Rubber
|
N/A
|
0.6%
|
|
|
Diapers
|
3.5%
|
3.5%
|
|
|
Other Organics
|
8.3%
|
4.0%
|
|
|
Total Organics
|
26.3%
|
31.3%
|
|
Ferrous Metal
|
|
|
|
|
|
Food Containers/Bi-metal
|
2.7%
|
1.8%
|
|
|
Aerosols
|
N/A
|
0.4%
|
|
|
White/Enameled
|
N/A
|
0.2%
|
|
|
Auto Parts
|
N/A
|
0.3%
|
|
|
Other Ferrous
|
2.9%
|
1.5%
|
|
|
Total Ferrous Metal
|
5.6%
|
4.2%
|
|
Non Ferrous
Metal
|
|
|
|
|
|
Aluminium Cans
|
0.8%
|
1.0%
|
|
|
Aluminium Foil
|
N/A
|
0.9%
|
|
|
Other Non-Ferrous
|
N/A
|
0.2%
|
|
|
Total Non
Ferrous Metal
|
0.8%
|
2.1%
|
EXHIBIT 4-2 (continued)
ORANGE COUNTY WASTE CHARACTERIZATION STUDY
COMPARISON OF RESIDENTIAL WASTE
COMPOSITION – 1995 VS. 20001
|
Material Components
|
Mean Composition 1995
|
Mean Composition 2000
|
|
|
|
|
|
|
Glass
|
|
|
|
|
|
Bottles & Jars
|
5.8%
|
N/A
|
|
|
Container Glass-Clear
|
N/A
|
1.9%
|
|
|
Container Glass-Green
|
N/A
|
0.5%
|
|
|
Container Glass-Brown
|
N/A
|
1.8%
|
|
|
|
0.5%
|
0.8%
|
|
|
Total Glass
|
6.3%
|
5.0%
|
|
Wood
|
|
|
|
|
|
Pallets
|
N/A
|
0.2%
|
|
|
Lumber
|
1.9%
|
1.3%
|
|
|
Painted/Treated
|
1.1%
|
<0.1%
|
|
|
Stumps/Heavy Sections
|
N/A
|
<0.1%
|
|
|
Total Wood
|
3.0%
|
1.5%
|
|
Inert
|
|
|
|
|
|
Asphalt
|
N/A
|
<0.1%
|
|
|
Concrete/Brick/Rock
|
N/A
|
<0.1%
|
|
|
Dirt
|
N/A
|
0.1%
|
|
|
Other Inert
|
N/A
|
0.4%
|
|
|
Total Inert
|
2.6%
|
0.5%
|
|
|
|
|
|
|
Yard Waste
|
|
1.0%
|
0.9%
|
|
|
|
|
|
|
Special Waste
|
|
|
|
|
|
Lead Acid Batteries
|
N/A
|
<0.1%
|
|
|
Dry Cell Batteries
|
N/A
|
0.2%
|
|
|
Oil Filters
|
N/A
|
<0.1%
|
|
|
Other Hazardous Waste
|
0.3%
|
0.6%
|
|
|
Infectious Waste
|
0.0%
|
N/A
|
|
|
Reusable Waste
|
N/A
|
<0.1%
|
|
|
Total Special Waste
|
0.3%
|
0.2%
|
|
|
|
|
|
|
Brown Goods
|
|
|
|
|
|
Electronic Goods
|
N/A
|
0.9%
|
|
|
|
|
|
|
TOTALS
|
|
100%
|
99.0%
|
|
|
|
|
|
NOTES: 1. Individual numbers may not total exactly, due to
rounding
EXHIBIT 4-3
ORANGE COUNTY WASTE CHARACTERIZATION STUDY
COMPARISON MULTI-FAMILY WASTE
COMPOSITION – 1995 VS. 20001
|
Material Components
|
Mean Composition 1995
|
Mean Composition 2000
|
|
|
|
|
|
|
Paper
|
|
|
|
|
|
Newspaper/Print
|
7.3%
|
5.6%
|
|
|
Glossy Magazines
|
5.0%
|
4.1%
|
|
|
Recyclable Corrugated Cardboard
|
7.2%
|
2.8%
|
|
|
Non-Recyclable Corrugated Cardboard
|
N/A
|
2.0%
|
|
|
Phone Books
|
N/A
|
0.5%
|
|
|
Coated Containers
|
1.0%
|
1.6%
|
|
|
Paperboard
|
N/A
|
4.6%
|
|
|
Hard Back Books
|
N/A
|
<0.1%
|
|
|
Other Books
|
N/A
|
0.4%
|
|
|
White Ledger
|
N/A
|
3.8%
|
|
|
Mixed Office Paper
|
1.3%
|
5.5%
|
|
|
Other paper
|
22.6%
|
5.2%
|
|
|
Total Paper
|
44.4%
|
36.1%
|
|
Plastics
|
|
|
|
|
|
PET Bottles (#1)
|
1.4%
|
2.4%
|
|
|
HDPE Bottles (#2)
|
1.2%
|
1.9%
|
|
|
Film
|
5.5%
|
4.8%
|
|
|
PVC (#3)
|
0.5%
|
0.8%
|
|
|
Expanded Polystyrene (#6)
|
N/A
|
1.8%
|
|
|
All Rigid Containers
|
1.0%
|
1.9%
|
|
|
All Other Plastics
|
4.0%
|
1.4%
|
|
|
Total Plastics
|
13.6%
|
15.0%
|
|
Organics
|
|
|
|
|
|
Food Waste
|
9.7%
|
21.2%
|
|
|
Textiles/Leather
|
3.3%
|
4.9%
|
|
|
Rubber
|
N/A
|
0.5%
|
|
|
Diapers
|
2.8%
|
2.5%
|
|
|
Other Organics
|
7.8%
|
1.7%
|
|
|
Total Organics
|
23.6%
|
30.8%
|
|
Ferrous Metal
|
|
|
|
|
|
Food Containers/Bi-metal
|
2.6%
|
2.0%
|
|
|
Aerosols
|
N/A
|
<0.1%
|
|
|
White/Enameled
|
N/A
|
<0.1%
|
|
|
Auto Parts
|
N/A
|
<0.1%
|
|
|
Other Ferrous
|
1.9%
|
1.9%
|
|
|
Total Ferrous Metal
|
4.5%
|
3.9%
|
|
Non Ferrous
Metal
|
|
|
|
|
|
Aluminium Cans
|
1.0%
|
1.3%
|
|
|
Aluminium Foil
|
N/A
|
1.7%
|
|
|
Other Non-Ferrous
|
N/A
|
0.4%
|
|
|
Total Non
Ferrous Metal
|
1.0%
|
3.4%
|
EXHIBIT 4-3 (continued)
ORANGE COUNTY WASTE CHARACTERIZATION STUDY
COMPARISON OF MULTI-FAMILY WASTE
COMPOSITION – 1995 VS. 20001
|
Material Components
|
Mean Composition 1995
|
Mean Composition 2000
|
|
|
|
|
|
|
Glass
|
|
|
|
|
|
Bottles & Jars
|
5.8%
|
N/A
|
|
|
Container Glass-Clear
|
N/A
|
3.10%
|
|
|
Container Glass-Green
|
N/A
|
0.9%
|
|
|
Container Glass-Brown
|
N/A
|
3.0%
|
|
|
Other Glass
|
0.4%
|
1.2%
|
|
|
Total Glass
|
6.2%
|
8.2%
|
|
Wood
|
|
|
|
|
|
Pallets
|
N/A
|
0.2%
|
|
|
Lumber
|
0.6%
|
1.2%
|
|
|
Painted/Treated
|
0.8%
|
<0.1%
|
|
|
Stumps/Heavy Sections
|
N/A
|
<0.1%
|
|
|
Total Wood
|
1.4%
|
1.4%
|
|
Inert
|
|
|
|
|
|
Asphalt
|
N/A
|
<0.1%
|
|
|
Concrete/Brick/Rock
|
N/A
|
<0.1%
|
|
|
Dirt
|
N/A
|
0.2%
|
|
|
Other Inert
|
N/A
|
0.3%
|
|
|
Total Inert
|
3.2%
|
0.5%
|
|
|
|
|
|
|
Yard Waste
|
|
2.2%
|
0.3%
|
|
|
|
|
|
|
Special Waste
|
|
|
|
|
|
Lead Acid Batteries
|
N/A
|
<0.1%
|
|
|
Dry Cell Batteries
|
N/A
|
0.3%
|
|
|
Oil Filters
|
N/A
|
<0.1%
|
|
|
Other Hazardous Waste
|
0.1%
|
<0.1%
|
|
|
Infectious Waste
|
0.0%
|
N/A
|
|
|
Reusable Waste
|
N/A
|
<0.1%
|
|
|
Total Special Waste
|
0.1%
|
0.2%
|
|
|
|
|
|
|
Brown Goods
|
|
|
|
|
|
Electronic Goods
|
N/A
|
0.8%
|
|
|
|
|
|
|
TOTALS
|
|
100%
|
101.0%
|
|
|
|
|
|
NOTES: 1. Individual numbers may not total exactly, due to
rounding
Appendix E
WASTE REDUCTION GOAL
FOR ORANGE COUNTY NORTH CAROLINA
Original ten-year waste reduction goal for FY2001-02: 45%
per capita
Original ten-year waste
reduction goal for FY2005-06: ` 61% per capita
After considering your
government’s current and projected solid waste activities, resources,
population and economic growth, will the FY2005-06 goal change? NO, but
implementation is delayed until further into the ten year planning period.
Why? N/A Delayed primarily
due to fiscal constraints.
CALCULATING AND SETTING A NEW
FY 2013-14 WASTE REDUCTION GOAL
FY2002-03 tonnage landfilled
56,925 tons MSW + 19,909 C&D + 137 LCID + 184 tons mobile homes + 1-ton
alum sludge + (estimated out of county disposal (not including that recycled at
certified C&D facilities 12,392): Total projected to be landfilled during
FY2002-03:
89,547
DIVIDED BY:
Projected
population for Orange County 2002-2003: 119,746 (Office
of State Planning)
Estimated tonnage per capita landfilled in FY2002-03: 0.748
tons per capita
Using state data: waste
reduction rate compared to FY1991-92 is 45%
Establish a FY2013-14 per
capita waste reduction goal by determining:
FY2013-14 population
projection (146,653) x per capita estimate for that year assuming no further
waste reduction from FY2002-03 (0.748) = projected tons
109,696
FY2013–14 population
projection (146,653) x per capita estimate (0.53) = 77,726
projected goal in tons.
Projected additional
tons to be managed via recycling, reduction,
composting, etc., not
landfilled to meet 61% goal in that year 31,970
Appendix F
Planning Element
Sheets
Guide to Plan of Action
Element 1: Reduction at
the source: See narrative in Program
Recommendations for Solid Waste Updates. Page F-2 through F-5. This is
organized by sector --residential and commercial.
Element 2: Solid Waste
Collection: F-6 through F-9
Element 3: Recycling and
Reuse: F-10 through F-18
Element 4: Composting and
mulching: See narrative, page F-19
through F-20
Element 5: Incineration
with or without energy recovery: Orange County has no
plans to implement incineration facilities for management of solid waste. F-21
Element 6: Transfer outside
geographic area covered by the plan:
Preliminary siting and cost work has been done pertaining to the concept of
locating a transfer station at the current landfill site on Eubanks Road.
Additional sites may be considered by BOCC. F-21
Element 7: Disposal
capacity: At current rates of use,
the disposal capacity at Orange County Landfill is 18 months for C&D
(winter 2001-02) and six years for MSW (2009). No other decisions pertaining to
future disposal capacity have been made yet. F-21
Element 8: Education with
the Community and through the Schools:
See narrative page F-22 through F-27.
Element 9: Special Waste:
tires, white goods, yard waste, septage, HHW): see narrative page F-28 through F-29
Element 10: Illegal
disposal, litter: See narrative, page
F-30.
Element 11: Purchasing
recycled products: See narrative,
page F-31.
Element 12: Disaster
Response: See narrative, page F-32.
Element 1: Waste Reduction at the Source
Subelement Residential
Backyard composting
Orange Community Recycling continues
to maintain and support four compost demonstration sites at: the Chapel Hill Community Center,
Cooperative Extension in Hillsborough, Scroggs Elementary
School and one at the UNC Botanical
Gardens. These sites are used for school tours, education and demonstration
programs. All sites, except that at the Community Center, are operated by the
occupants of the location. The Community Center site is operated by Orange
Community Recycling.
Sales of backyard compost
bins are conducted annually. The last three sales were held in Spring 2001,
Spring 2002 and Spring 2003. We typically cooperate with Chatham County in
advertising, scheduling and conducting the sales in order to meet the vendor’s
threshold of 400 bin sales before they are willing to come to our site with a
truck. During the past three sales, we have used the “Earth Machine” as they
have been willing to absorb all risk of selling the bins, i.e. we do not have
to first buy bins then resell them. That is much more convenient for us than
the requirements of other vendors that we buy the bins from them and resell to
the public.
The County-wide MSW waste
characterization, conducted in October and March of 1999-2000, showed that food
waste was 17.8% of total residential waste by weight. Although this is a
higher percentage of residential waste than five years ago (11.2%), total
residential waste has not generally increased during that period. We conclude
that more diversion is taking place; with the average 2% growth in Orange County
population we would have expected a commensurate rise in MSW, which has not
happened based on known landfill tonnage, which has remained flat for the past
two years. Recycling tonnage does not account for all the difference in tonnage
between that projected based on a population growth and what was actually
landfilled. The rest is presumed to be due to reduction.
Compost bin sales in Orange County average
about 300 per event. Customer surveys showed that about 50% of the customers
were not composting food waste prior to buying the bin and about half of that
50% state they intend to begin food waste composting with the new bin.
Recommendation: We will continue our demonstration sites and annual
sale of backyard composting bins at cost plus $2 ($39 last year). That additional
$2 helps defray our bin sale's advertising costs. Based on our sales history,
an annual sale seems to meet the demand level for new bins at a lower cost than
retail stores which report selling few bins at about $75/each. We plan the
annual countywide compost bin sale in the spring of 2004. We encourage those
who cannot make the annual sale to buy at Durham or Wake, which have permanent sales sites. Orange County will
consider permanent sales at its planned new administration building to be sited
at the landfill.
Grasscycling
In our waste sorts and at the
curb, we see very little grass in the MSW waste stream. Casual observation is
generally grass is left on the lawn, and/or not collected in municipal yard
waste programs. We have not conducted a formal grasscycling program.
Recommendation: We see no need for a formal grasscycling program at
this time.
Xeriscaping
Landscaping with less water.
Water and sewer services are managed separately by Orange Water and Sewer
Authority in southern Orange, the Town of Hillsborough and several private water companies. The Solid Waste
Management Department is not responsible for any water conservation activities
but we do produce and sell an average of over 7,000 tons of landscape mulch
annually. (Last year due to the ice storms, we took in 36,000 tons).
Following the drought last year, the County Emergency Management Department,
with advertising assistance from the Solid Waste Department, conducted a sale
of rain barrels to enhance use of rainwater for outdoor irrigation. At that
event, eighty-five barrels were sold directly by a private vendor to Orange County
residents.
Orange Water and Sewer
Authority’s new conservation efforts include promotion of outdoor water use
conservation, use of more efficient water-using devices, seasonal water use
rates reflecting a higher cost in summer when demand is higher and reduced cost
in winter. In addition, the Authority plans to offer outdoor use water audits
to large-scale users who are on city water. Town of Hillsborough's
water and wastewater department instituted a conservation program during the
drought.
Recommendation: Provide support to xeriscaping projects by others
and continue to provide high quality mulch at a reasonable price. Conduct study
of revegetating closed portions of landfill with native plants during 2003 and
beyond.
Junk Mail Reduction
Orange Community Recycling
was one of the first in North Carolina to produce a “junk mail terminator kit” that has been
widely copied by others. We have simplified this 'kit' to a single card that
goes to a single vendor and publicize the national opt-out of junk mail
programs on our web site and through other promotions such as in the annual Waste
Matters newsletter.
Recommendation: Continue to publicize and promote junk mail
reduction by citizens and local government offices. According to recent audits
of County government buildings, some junk mail reduction efforts are in place.
Enviroshopping
Through our display boards
and presentations, we promote reduction in packaging and consumer use of own
bags, etc. During each year, at least one of our monthly articles in the local
newspaper cover purchasing of recycled products. In 2001, we conducted a
statewide buy recycled promotional conference that was well received and well
attended. We publish a "Wasteline" guidance sheet on buying recycled
products.
Recommendation: Provide more information to the public on
enviroshopping and during FY2004-05 explore the concept of getting “shelf
talkers” in local grocery stores to promote this program.
Use of Non-toxics
As a part of the household hazardous waste collection
program, we promote the use of non-toxic alternatives and the use of smaller
amounts of hazardous materials, i.e. use only the amount of paint necessary.
Recommendation: Continue to promote the use of non-hazardous
alternatives for pesticides and other highly toxic/expensive to dispose
products more cooperatively with Triangle J Council of Governments during
2001-2002. TJ COG prepared a series of inserts to the regional HHW materials
promoting waste reduction and use of alternatives for paint and pesticides that
our office routinely distributes to citizens.
End
sub-section on residential waste reduction at the source.
Subelement - Commercial/Industrial
General C&I Source
Reduction
We periodically promote those
businesses and institutions that have successfully reduced waste through both
our newspaper articles and in our annual newsletter. At least once a year, we
write a piece for the Chapel Hill Herald (circ 14,000) and/or Chapel Hill News
(circ. 22,000) spotlighting those businesses. We also spotlight waste reducing
businesses in our annual newsletter (see 2003 newsletter attached). We provide
a monthly set of waste reduction and recycling tips published in the newsletter
(circulation 50,000) from Weaver Street Market grocery cooperative. We have
ongoing contact with the Chapel Hill-Carrboro Chamber of Commerce and the
Hillsborough/Orange County Chamber of Commerce on waste reduction concepts.
Our “Waste Watcher” program
publicly recognizing waste reducing businesses was dropped due to lack of
interest and lack of cost-effective recycling alternatives to low cost public
waste collection services available to commercial sector.
In FY2000-01, we conducted a
successful Buy Recycled workshop that attracted a statewide audience that was
predominantly public sector but with some private sector participation.
In-house waste audits of 38 local government buildings were initiated in all
four governments in Orange County during FY2002-03 and follow-ups are being
conducted in FY2003-04 promoting waste reduction through use of double-sided,
copying, use of used paper in fax machines and junk mail reduction (see sample
audit report) and rank progress.
During the FY1999-2000 fiscal
year, we solicited all the known 140 Conditionally Exempt Small Quantity
Hazardous Waste Generators (CESQGs) in Orange County to participate in a hazardous waste collection to be
conducted in conjunction with our monthly HHW program at the landfill. We got
no positive responses from the mailing. We hope to open our current HHW
program to CESQGs at a very low disposal cost later this fiscal year.
Waste Assessments
We performed only one
commercial (church) waste audit last year and none in several of the preceding
years although we continue to promote the option for requesting a waste audit
in our annual newsletter which is mailed to all businesses and residences in Orange County.
Recommendations: Use Waste
Matters newsletter and Chambers of Commerce to continue to promote waste
audits throughout the County and get more businesses interested in waste
reduction activities especially through the newspaper articles focusing on
businesses that successfully reduce waste.
Write at least two pieces during
FY2003-04 that promote waste-reducing businesses.
Identify a service project linking
business recycling in the community.
Local governments in Orange
County could include in their purchasing specifications a variety of measures
to enhance source reduction such as requiring contract caterers to use provide
bulk servings of cream, sugar and condiments. Contractors are now required to
state how they plan to reduce and recycle construction or other job-related
wastes as part of their bids for Town of Chapel Hill or County projects.
Contractors must provide solid waste plans as a condition of any permit. The
County C&D waste reduction team further promotes deconstruction or moving
of in-tact structures as realistic alternatives to demolition.
End section on
waste reduction at the source.
Element 2: Solid Waste Collection
Efficiency
Solid waste collection
efficiency: individual governmental haulers haul over 71% of the MSW landfilled
in Orange County. In general, collection efficiency has been increased
in each municipal jurisdiction by addition of more efficient equipment and
collection methodologies including:
- automating the residential
waste collection equipment in the Town of Hillsborough,
- changing to semi-automated
curbside residential collection in Chapel
Hill,
- creating economic
incentives using pay-as-you-throw commercial collection in all three
Towns; NOTE: each Town pursued this differently,
- increasing dumpster
inspections to improve compliance with bans on disposal of wood, metal and
corrugated cardboard,
- initiating scheduled
residential brush collection, within the Town of Chapel Hill
as an offshoot of increased efficiency of residential waste collections,
- County Solid Waste
Convenience Centers now offer a wider variety of recycling services
including batteries, oil filters, scrap metal, clean wood and electronics.
(NOTE: this does cause additional collections from SWCCs)
Efficiency
increases at the Orange County landfill operation include:
Purchasing an industrial wood
waste grinder to handle the increased volume of woody waste from both
vegetative waste and clean construction wood. The grinder enables the County to
process wood waste as needed instead of waiting until the quarterly visits from
the grinding contractor. Provision of a variety of screens and magnets also
enabled the County to meet specifications of boiler fuel or colored mulch
manufacturers that the contractor could not meet. Thus markets improved for the
wood products produced at the landfill. If processing area can be identified,
the County will also consider making topsoil from the screenings from mulch
production.
Purchase of tractor and
trailer to haul increased volumes of scrap metal, chipped wood and other
recyclable materials to market. This has proven to be much cheaper and more
flexible than contract hauling.
Development of a construction
waste recycling area for the regulated recyclable materials at the front of the
north side of the landfill. This area consists of a series of separate pads and
covered storage areas for mulch products enables contractors who have separated
their materials to easily drop off regulated items before heading to the more
remote landfill site. The concrete pads for scrap metal, white goods and the
separate pad and shelter for corrugated cardboard allow more efficient policing
of the site in addition to quicker movement and loading of materials. The
covered area with stationary compactor for corrugated cardboard enabled the
elimination of six dumpsters at the C&D landfill face that had to be
collected several times a week, taking an extra half hour of truck route time
for each trip to the C&D site. Purchase of a road tractor and two
different styles of trailers improved hauling efficiency and lowered the cost of
scrap metal and wood chip hauling below that available from contract hauling.
Planned piping of leachate
directly to the wastewater treatment plant using a new sewer line to be
installed at the landfill leachate collection pond. This improvement will reduce
staff requirements to haul leachate to the sewage treatment plant, now a
halftime position including a tanker truck, which will be eliminated from the
fleet. We will eliminate the 1,700 gallons of diesel fuel used annually for
hauling leachate. Using the sewer system will also reduce the likelihood of
overflows at the leachate pond in case of significant storm events. Projected
cost savings are $15,667 annually over the life of the project (see savings
calculation sheet appendix G).
In
2001, with State permission, the County was able to eliminate four groundwater
monitoring wells on the north side of the landfill and in 2002 two more on the
south MSW landfill from the monitoring system. Previously we had reduced
testing frequency from quarterly to semi annually due to the lack of positive
test results at the wells. We were able to make these reductions because, on a
statistical basis, over ten years, groundwater flow patterns indicate that
contaminants should not be present. Testing cost savings from elimination of
the six wells are about $9,000 per year.
Collection Set out limits
Residential
·
Town of Carrboro: Two-cart maximum.
·
Town of Chapel Hill: One cart maximum, some bags collected if at
the cart
·
Town of Hillsborough: Collects one cart per family per week, but
extra bags of solid waste are also collected. If there is extra solid waste
overflowing from the can routinely at a residential stop, sanitation personnel
may encourage the generator to consider recycling in order to reduce the amount
of waste and / or investigate to find out if the resident is accepting waste
from someone else (outside Town limits).
·
Orange County: County convenience sites accept any amount of
residential waste. The County limits amount of non-bagged waste such C&D,
bulky materials and brush to ½ a pickup truck or trailer. Those exceeding this
amount are issued permits to use the landfill. No dump trucks are allowed at
convenience centers. They also accept bulky items, electronics, separated wood
and scrap metal and 1/2 pick-ups loads of self-generated residential
construction waste.
·
Private haulers of rural residential waste: Typically they have
variable prices for more than one cart or for a greater collection frequency
than once a week. e.g. one has a $16 fee for one each 90-gallon cart per week
or $26 for two 90-gallon carts. If a customer uses his own 30-gallon can, he is
charged $3, for a 40-gallon can it’s $5. Some haulers also prohibit
collection of materials in excess of the amount in a cart they issue.
Recommendations: Strictly enforce set-out limits. Consider charging
for volumes that exceed set out limits. Begin to charge for permits issued at
Solid Waste Convenience Centers to use County landfill.
Commercial and Multifamily
Waste
Table F1 Cost of non-residential waste disposal in
Towns within Orange County
|
Town
|
Annual Cost
|
Comments
|
|
Carrboro
|
4CY $856
6CY $1000
8CY $1,140
Twice a week is double
the above rates
|
Multifamily housing still
collected 2x/week, tax supported
|
|
Chapel Hill
|
$700/year for first weekly
dump of an 8 yd container. 2nd dump $500
|
Multifamily gets one tax
supported collection/week. $700 for additional weekly dump for each dumpster
|
|
Hillsborough
|
1/wk 2/wk
2CY $430
$859
4CY $601
$1201
6CY $772
$1544
8CY $943
$1886
|
Completely private, all
non single family residential customers using dumpsters pay franchise
contractor
|
·
The Town of Chapel Hill services two key-operated compactors
serving about 80 downtown businesses. Those businesses pay the Town an annual
fee for compactor use on a three-tier system based on frequency of use: small
(up to 9 uses of compactor per week or 225 per year where each use of the
compactor hopper represents up to 12 each thirty gallon bags is $225 annual
fee), medium (10 –14 uses for $600 annually), or large trash generator (15 or
greater uses per week at a $1,200 fee). These fees represent full cost
recovery. New businesses automatically come aboard as a “medium” unless they
show lower or higher volumes. If they can prove through a “key audit” that
they’ve reduced their trash, they can lower their annual fee.
- In Hillsborough transfer of commercial collection from public
to private sector resulted in a $90,000 decrease in landfill tipping fees;
$30,000 reduction in salary/benefits as well as reduction in operations
& maintenance cost for commercial garbage truck.
Safety
Safety has improved particularly in Hillsborough and
Chapel Hill residential collections due to the move to automated collection in
Hillsborough and semi-automated collection in Chapel Hill at the curb.
Incidence of worker injury attributable to backyard collections including dog
bites, bee stings, falls and back strain due to lifting and carrying overweight
cans from backyards have been eliminated.
In Hillsborough, accidents in the Sanitation Division of
Public Works were reported to have fallen from 2 in 2000-2001 to zero in
2001-2002 and 2002-2003.
Elimination of commercial collection by public sector
employees in Hillsborough, decreasing the number of collections in Chapel Hill
and Carrboro due to imposition of economic incentives has reduced potential for
worker injury in this sector of sanitation collections.
Safety improvements to the landfill and recycling operation
include:
Building a shelter over the recycling processing area to
provide better working conditions in inclement, hot or cold weather,
Compliance with an OSHA inspection that pointed out a
variety of violations of safe procedures in the recycling processing area and
other parts of the landfill,
Developing a formal safety officer position at the
landfill and recycling operations,
Implement training on all
vehicles equipment plus the certification of operation for all pieces of
equipment located at the Orange County Landfill,
Started documentation of all
safety program meeting and other required training as required by all state,
local, and department regulations,
Implemented on site training
relating to SWANA’s Landfill Safety training program with certification upon
completion of program.
Element
3: Recycling and Reuse
Subelement Recycling
The County operates a variety
of recycling programs including:
- Weekly urban curbside for
$3.50 per household per month serving 16,000 households, 3,315 tons
collected in FY2002-03. Cost $740,000.
- Biweekly rural household
for $2.00 per household per month serving 10,000 households, 1,200 tons
collected. $220,000.
- Multifamily recycling
serving 14,000 households, contract cost was $100 per single site per month
through December 2002, program is now in-house. 1,078 tons collected.
- Drop-off site recycling at
12 sites, 6 staffed and 6 unstaffed, program in-house 5,757 tons.
- Hazardous waste collection
on contract four days per week at landfill 80 tons.
- Commercial glass and can
recycling program from 100 bars and restaurants tons combined with
drop-off.
- Food waste composting
collection program from 20 sites at $70,000 annually. 811 tons collected.
- Motor oil, oil filters,
battery collection from six staffed convenience centers 190 tons.
Electronics recycling collection six days per week at landfill 30 tons.
- In-house government
buildings, 81 tons.
Materials collected by
curbside recycling contractor are sold by contractor and contractor keeps all
revenue to defray program expenses. Food waste is all by contract.
County operates multifamily,
drop-off, commercial, in-house programs. All fiber is hauled directly to
market. Cans and bottles are processed by county staff and all except aluminum
cans are hauled to market by county staff. No program makes money. Revenue last
year from sale of recyclables was $163,000 while program expenses exceeded $2.4
million.
General education efforts are
detailed under element 8, education in the community and schools. Efforts
specific to individual program performance are detailed in this section.
Collection Efficiency
We continuously review all recycling collection routes for
potential efficiency improvements. That includes: curbside recycling, rural
curbside recycling, multifamily recycling, drop-off sites, commercial glass and
food waste, government in-house collection programs. Those routes that are
contracted tend to be reviewed periodically by the contractors for improvements
that save them time, fuel and money.
Ongoing recycling collection efficiency improvements
conducted in FY2000-03 this year include:
·
Reducing or increasing the
frequency of collections or number of carts at select multifamily sites
depending on volume when we took program in-house in January 2002, (initially we
had an eight percent reduction in the number of roll carts we used compared to
what the contractor used.)
·
Continuous promotion in all
relevant departmental literature of the concept of setting out curbside
recycling bins only when they are full. In the past we made efforts to
encourage bin twinning but had no noticeable success getting people to put
their bins adjacent to each other, thus making fewer collection stops.
·
Continuous review of commercial
glass, fiber collection route, drop-off sites, and local government building
collection programs that the County operates to fit collection routes to our
schedule constraints, market location and availability/hours of operation (we
have made an arrangement with local paper broker to enable us to drop off mixed
paper when they are not open for business, thus greatly improving our
scheduling).
·
Takeover of hauling glossy
magazine hauling saved significant costs from contractor hauling.
·
Elimination of six dumpsters for
OCC from C&D landfill face and replacing them with a compactor at the north
side thus eliminating one to two trips per week to service those dumpsters at a
half hour per trip.
·
Periodic mutually agreeable (with
contractor) routing changes in curbside collection routes to optimize
collection efficiency. We attempt to minimize re-routing to reduce customer
confusion and expense.
·
Switch recycling only #1 and #2
plastic bottles to all plastic bottles at all recycling venues made plastic
bottle recycling easier, added aerosol cans as a new material and increased
availability of added phone book from only specialized drop off recycling to
curbside, multifamily and drop-off mixed with newspapers so phone books can now
be readily recycled all year everywhere, not just a special collection times
when new books are distributed.
·
Changed HHW recycling from once a
month to four days per week at a permanent staffed site at the landfill reduced
costs 25%.
Recommendation: Continue existing empirical approach to efficiency
improvements and continue to test and explore markets for new materials. The
County is evaluating and will consider taking over the Rural Curbside Recycling
collections in 2004-05 if it appears cost-effective and more efficient.
Participation
We run periodic print ad campaigns to remind people of
curbside recycling availability and any schedule changes for the holidays. We
ran a “Got Bin?” series when UNC came back into session to remind newcomers
where to get a curbside recycling bin. We ran an ad campaign to remind citizens
they could now recycle aerosol cans and all plastic bottles at the curb. We
also run ads to try to reduce curbside contamination, particularly from plastic
bags and mixed paper. The switch to 'all bottles' from #1 and #2 only raised
plastic bottle tonnage 14% (net of projected discards from #3-#7 bottles that
are included under this scheme).
Urban curbside program participation (defined at setting
out at least once a month) is estimated at over 90%. Rural curbside
participation averages 50% monthly according to the contractor's count. These
are relatively stable compared to recent years.
Over 90% of multifamily complexes have recycling service;
it is impossible to gauge individual unit participation levels. Low performing
complexes or those with consistent contamination are singled out for door to
door education campaigns and placement of outdoor bilingual (English/Spanish)
educational signs at the recycling sites. Blurbs are periodically sent to
various complexes to insert in their apartment complex newsletters. Tonnage is
stable.
Twice a year we place
“reminder” signs along the rural curbside recycling routes because those routes
are serviced biweekly. Our review, after signs were placed last year, showed a
temporary increase in bin set outs of about 3%. Signs are placed on each route
twice per year for six weeks.
Calendar cards are sent to
all citizens on the rural recycling routes at the beginning of each fiscal year
to remind eligible households of their collections days for the year. This is
done due to the fact that collection is biweekly, not weekly, and therefore it
is harder to remember each collection day. Once a year, usually in spring,
reminder cards are sent to low-participation rural routes in an attempt to
boost participation. The impact of these cards has not been great.
This year we sent a holiday
schedule change card to all 5,500 customers whose routes were affected by
Christmas and New Year's Day changes. This significantly reduced complaints and
telephone calls. Makeup day setouts were noticeably higher than ever before.
Our display boards and
literature racks at each recycling site and some government buildings have
posters that are periodically changed, updated and refreshed to reflect program
changes or just keep literature in stock.
Recommendation: As long as programs remain voluntary, continue with
multiple media outreach strategies detailed above to increase participation.
Disposal Diversion Ordinance
At the landfill face of both the MSW and C&D disposal
areas, inspectors rigorously enforce the state disposal bans on yard waste,
batteries and hazardous wastes and our own bans on non-residential corrugated
cardboard, scrap metal and clean wood waste. Last year revenue from penalties
for ordinance violations totaled $69,000.
In FY2001-02, the Board of
Orange County Commissioners passed a Regulated Recyclable Materials Ordinance
that prohibited the disposal of scrap metal, clean (unpainted, untreated) wood
waste and corrugated cardboard anywhere, not just the Orange County
landfill. The ordinance was based on a recommendation from the
County-appointed construction and demolition waste recycling task force in
their August 2000 report. The ordinance was implemented in October 2002 after a
year of fine-tuning, education of the regulated community and work with the
towns to obtain their passage of the ordinance NOTE: Town of Chapel Hill
has not formally adopted it. It has been highly effective in reducing the
amount of waste delivered to the C&D landfill (see introduction to this
report). We believe it is the only ordinance of its type in the country.
Recommendation: Continue enforcement of the ordinance and expand the
education, outreach and enforcement to the commercial sector focusing on
generators of clean wood and scrap metal such as lumberyards, bicycle shops and
auto body repair places. Modify ordinance as necessary.
Pay-As-You-Throw (and mandatory recycling)
Pay-as-you-throw was an element to be considered by each
jurisdiction as part of “waste prevention” in the plan adopted in 1997. In
early 1999, the Town of Chapel Hill convened a citizen’s task force to consider
this option. No jurisdiction within the County has recently considered PAYT for
residential sector. It is de facto in place now for the commercial sector in
all three towns in differing manners. See table in non-residential section
below.
Conceivably one or more
individual governments within Orange County may adopt a solid waste ordinance, such as
pay-as-you-throw or mandatory recycling that has potential to increase the amount
of recyclables generated from only that jurisdiction.
Recommendation:
Continue to work with the various jurisdictions towards a coordinated waste
reduction strategy.
Towns
should further promote use of Orange Community Recycling technical services to
work with businesses that wish to reduce their waste volume to save on
compactor fees or extra dumping costs.
Material Expansion
In 2000-2001 expanded curbside and multifamily recycling
to include telephone books, aerosol cans and all plastic bottles. In fact, at
the plastic bottle sorting facility, anything not a #1 PETE or #2 HDPE bottle
is discarded due to small volumes and lack of markets, but even factoring that
in, plastic bottle recycling still increased 14% following the change to the "recycle
all plastic bottles" message.
Drop-off recycling collections or mixed paper rose from 50
tons per month in the first year to over 80 tons per month in FY2002-03.
Electronics recycling was added in April 2002. In July
2002 we conducted a second collection and in April 2003 we changed to a
permanent collection program at the landfill including storage and processing
facilities. Electronics can also be dropped off at any of the six solid waste
convenience centers. Electronics includes televisions, computers and
peripherals, telephones, fax, copiers, stereos, and anything else that
transmits voice or data.
Added plastic bottles to commercial glass and metal can
collection route in FY2000-01.
Scrap metal and clean wood
waste recycling were added to recycling program as a function of the RRMO ban
implemented in FY2002-03.
Recommendation: Continue to consider new materials for recycling as
long as stable markets arise and funding is available while realizing the
constraints of source-separated collections and limits to the number of people
willing to use drop-off sites instead of house-to-house services.
Review Markets
We routinely check pricing at two to three local paper
markets and send newspaper, corrugated cardboard and glossy magazines where we
can gain the most revenue or where we are obligated by contract to send a
certain minimum. Mixed paper is accepted at a local market for no fee or
revenue. Markets for scrap metal and wood chips are continuously reviewed for
price and availability.
Container Recovery Alliance in Raleigh is the only
reliable local market for container glass that pays well enough. We send
virtually all our of bottle glass there because it is color separated and
marketable as container glass. Prices received for glass are fixed by the
buyer, and are currently set as $27 ton for clear, $17 for brown, (-$12) for
green. NOTE: we are considering ways to divert the green glass for
other non-bottle uses for which we could possibly receive some revenue instead
of paying to get rid of it.
Flattened aluminum cans and foil are sold to the company
that provides the can separator/flattener/blower and tractor-trailer for
storage and hauling. Orange County bales its steel cans and hauls them to
market in its own tractor and trailer. Price is under $10 per ton now.
Bales of mixed plastic #1, 2,
5 and 7 bottles are sold to Waste Management/Recycle America in Raleigh,
recent price is $0.07 per pound. We have not been able to achieve an effective
separation of resin types to justify the expense of this extra step. If the
price of plastic bottle feedstock rises and our facility becomes more
sophisticated, we will reconsider sorting bottles. To upgrade the material
quality, we remove gross contaminants such as bags, bulky plastics, and some hazardous
waste bottles at the manual, outdoor, covered sorting area prior to marketing.
Recommendation: Continue to review markets monthly and support
steady buyers
regardless
of higher prices on “spot” markets that may come and go. Continue to
consider
ways to improve processing methods and product quality.
Regional Marketing
We have not entered any
regional marketing agreements. During our MRF study, we explored the option of
partnerships with a variety of adjoining local governments and institutions
including UNC and Duke.
Recommendation: Remain open to cooperative marketing ideas of
others.
Contracting for Diversion
None of our contracts has a diversion incentive built in.
They are all strictly fee-for-service at this point.
Recommendation: Consider diversion incentives for contractors in
contract years beginning July 1, 2004.
Small Businesses
Our routine policy in the urban curbside recycling program
is to provide curbside recycling for those small businesses, institutional
generators and small apartment complexes along existing residential routes. We
estimate that approximately 200 small businesses, churches, day cares, etc.,
participate in the urban curbside recycling program out of approximately 15,500
stops. A household may have more than one bin with no additional collection,
but for businesses or institutions we pay the contractor on a per-bin per month
basis. For example, we pay for three monthly stops ($3.50 x 3) if a business,
institution, etc. has been issued three bins from our office.
We do not generally have
business and non-residential stops on the rural curbside routes although there
a few churches and “country stores” are collected along the routes.
Recommendation: Continue to add small businesses and institutional
users that are along curbside routes as long as service is convenient and
volumes do not exceed those of standard bin collection programs (e.g.) four
bins per week.
Curbside Commercial/Industrial Collection
We provide this service only incidentally if the C/I type
generator is along a residential curbside recycling route. Otherwise our
service to this sector includes a source-separated glass and metal can program
for approximately 100 bars and restaurants generating over 500 pounds of
bottles and cans monthly and food waste collection for 20 restaurants, grocery
stores and institutions generating over two tons per month each. We provide
all carts and service for these programs at no cost to the generator. Special
collections of newspapers are provided to high quantity generators because they
are a very limited population e.g. a local newspaper publisher and a retirement
village.
Recommendations: Add more
bars and restaurants to food and container programs as feasible.
Drop off Commercial and Industrial Collection
We encourage use of the drop-off sites for limited amounts
of cans, bottles and paper from commercial generators. If a commercial
generator routinely generates more than 50 cardboard boxes per week, we
actively discourage their use of drop-off recycling sites and encourage use of
a collection service.
Construction and Demolition Waste Recycling
In December 1997, we instituted a salvage program at the
working face of the C&D landfill. That program with one permanent staff
person using a bobcat and a pickup truck diverts about 50 tons per month of
scrap metal, pallets, usable building materials and other related dry goods
delivered to that area. That program was abandoned in 2002 with implementation
of the new ordinance banning landfilling of scrap metal, clean wood and
corrugated cardboard. The scrap metal is sold to a regional scrap dealer.
Clean wood is ground for mulch or boiler fuel and delivered to market.
Cardboard is compacted for hauling to a paper dealer. Occasionally, in response
to a specific request, reusable goods are given to community based non-profits
for resale or use. We have eliminated the tipping fee on separated loads of
scrap metal and cardboard to encourage diversion.
Recommendations: Continue
to consider other materials for inclusion in the RRMO list as markets and
collection infrastructure become available.
Work with Triangle J Council of
Governments on regional wood waste recycling opportunities.
Longer term:
consider source-separated facilities for other materials as markets develop.
Subelement Reuse
Residential
Swap Shops: Four of Orange County’s six
convenience centers have swap shops, locally called ‘salvage sheds.’ The first
shed was put into service in 1993 when the County converted to staffed sites.
The fourth was built in FY2000-01 when one of the sites was moved to a new
location and rebuilt.
The sheds continue to operate at a high level of use and
popularity
Recommendation: Install
sheds at the remaining two convenience centers as space permits. Continue to
promote use of convenience centers for the general public. Limit use by
professional scavengers.
Paint Exchange: We operated a latex paint exchange
at the landfill from1992 through 2003.When the hazardous household waste
program became permanent, it required a full time contract staff person who
does not have time to properly open, assess, categorize and shelve each gallon
of incoming latex paint. All incoming paint is now recycled or mixed into
landfill alternative daily cover.
Recommendation: Continue
to look for ways to reduce paint exchange costs so the paint exchange can be
revitalized. Encourage “dry-out kits” for small amounts of paint and
discourage people from bringing unusable or very small amounts (e.g. less than
one pint) of paint.
End of Year Move Out Projects: Continue annual
work with UNC and specific local charities such as PTA Thrift Shops, Habitat
for Humanity and Interfaith Council Food Pantry to promote donations of
clothing, food, small appliances and other reusable items from those leaving
town in May instead of landfilling the materials. Specific activities include:
staffing of move out project at a large private dormitory near campus,
coordination with similar program at UNC dormitories, promotion of program to
apartment complexes through direct mail, intensive print advertising and
editorials in local newspapers during the last week of April and first part of
May.
Recommendation: Consider
expanding to selected large apartment complexes.
Magazine Rack At most drop off sites, there is a
rack labeled for placement and free exchange of glossy magazines. The rack is
used extensively at some drop-off locations while less so at others. Use of
the Magazine Rack is completely voluntary and some site users also scavenge magazines
directly from the recycling bins.
Recommendation: Continue
the program and expand along with new drop-off site development. Maintain site
monthly so magazines are relatively recent vintage and not weather-beaten.
Commercial/Industrial
Waste Exchange: We did not operate any type of
waste exchange for the commercial
or industrial sector. Triangle J Council of Governments
Eco-Industrial project
requested participation by industries located in Orange County
and none were interested. This project has been completed but has not been
implemented due to lack of interest by potential participants.
Recommendation: Encourage
participation in the State Division of Pollution Prevention and Environmental
Assistance waste exchange program.
Pallets: The landfill operated a pallet salvage
program that worked well but was quite labor-intensive. All pallets had to be
sized, stacked neatly and loaded by landfill staff in order to be removed by a
regional pallet recycling company. We receive only $0.50 for good “grocery
store” pallets and no revenue for other sizes. In 2002, we eliminated separate
pallet recycling and now accept pallets with other clean construction wood to
be ground into mulch or boiler fuel.
Boy Scout Troop 39 had a pallet collection program at
their site, outside the landfill. We paid them a $21 per ton tipping fee credit
to divert and remove pallets. They averaged several tons per month. This
program ended in 2001.The Boy Scout troop has since completely eliminated its
recycling activities.
Recommendation: Consider
a statewide ban on landfilling pallets. The private infrastructure exists to
handle pallets for refurbishing, reuse and recycling. At our landfill, consider
segregating them for reuse if prices rise and space and labor are available.
Material Salvage: Orange County conducted a
salvage operation at the working face of our construction and demolition
landfill from December 1997 through fall 2002. At maturity, the project
diverted 40 to 50 tons per month, two-thirds of which was scrap metal. The
other third was divided between pallets and reusable goods. The program was
largely discontinued when the RRMO was implemented, requiring contractors to
divert their recyclable wood, metal and cardboard. Staff meets occasional
specific requests for reusable goods.
Recommendation: Consider
reviving the salvage program in cooperation with an agency that could staff it
and make use of the reusable construction goods in a reuse store type venue.
Element 4: Composting
and Mulching
(residential composting is under element 1, waste
reduction)
Commercial Food Waste Composting:
Orange County has conducted a food waste diversion program
since 1995. During the
first four years, we used two different local, small-scale
hog farmers who took the
source-separated food waste from restaurants, prepared it
and fed it to their hogs. We
paid them a collection fee. We now pay a compost company
$77.25 per ton to collect and process the food waste from 20 restaurants and
institutions plus two UNC locations. This diversion averages over sixty-five
tons per month.
Recommendation: Expand
program to one hundred tons per month during the next fiscal year. Attempt to
get more post-consumer food waste from restaurants now providing only
preparation waste. Add more grocery stores to the program.
Wood Waste for Mulching
Orange County Landfill has been diverting the majority of
its municipal yard waste from the Town of Chapel Hill from its landfill since
1978. When yard waste was banned from landfilling, the County complied. Current
annual average intake of yard waste is about 7,000 tons per year. In FY2002-03
this rose to 36,000 tons due to ice storms. This high volume of material has
created a glut and therefore a marketing challenge.
The yard waste tipping fee of $15 per ton plus mulch sales
at $6 per cubic yard make this operation somewhat financially self-sufficient
internally. Any 'profits' fund other related solid waste management activities.
Orange County policy is not to give away its mulch but to maintain a high
quality that always has market value. Every load is evaluated for contaminants
before being deposited, nails are removed on grinding and the loads sit for at
least sixty days before sale.
Orange County conducted several experimental trials with
wood wastes and the result is we can now accept engineered wood along with the
solid sawn lumber for grinding as mulch or boiler fuel. We are now receiving
about 2,000 tons per year of clean construction wood waste that is chipped and
sold as boiler fuel or natural mulch or shipped to a dyeing facility to be
turned into decorative (red) mulch for sale. The product has sold reasonably
well as natural mulch at $6 per cubic yard or boiler fuel at $10 per ton. The
colored mulch priced at $25 per cubic yard has not sold well.
Recommendation: Continue
to accept the mix of solid sawn wood and
engineered wood to chip. From
mulch screenings, we will make topsoil to sell or
use for on site landscaping from
mulch as time, equipment and
space constraints allow.
Continue work with Triangle J COG
and private sector on regional use of
organics and wood wastes as
opportunities arise.
Divert Inert Materials from LCID and C&D Landfills
As part of work for the C&D recycling task force, we
have evaluated diversion of inert
debris from Orange County landfill. These materials make
up an estimated 40% of all
C&D material reaching the landfill. Much of it is
small broken material, not large
chunks of concrete or asphalt or large stumps from land
clearing. Due to the relatively
high C&D tipping fee of $41 per ton, LCID tends to go
elsewhere. Most of the organic
LCID type material we get is a yard waste or brushy
material suitable to our current
mulching operation.
Recommendation: Evaluate
lowering the tipping fee to encourage more LCID type material for future larger
scale processing that is not cost-effective with the small amounts of material
received. Continue to pursue a site in the northern half of the county to
store and process storm debris and LCID.
Element 5: Incineration with or without energy
recovery
Orange County has no intent to develop an incinerator.
Element 6: Transfer out of geographic area
The County's MSW landfill is projected to be available
through 2009 and the new C&D landfill through 2018. The County has no plans
to transfer waste out of county prior to that time. When the MSW landfill is
full, the BOCC has declared its intent to not build another landfill within Orange
County, thus transfer out of county is implicit. No further comments have been
made regarding the future of C&D recycling.
Element 7: Disposal
The County has landfill capacity for MSW through 2009 and
C&D through 2018 based on our most recent waste estimates, population
growth and a flyover of the landfill with topographic data included in the
projection. We do not accept out of county waste, enforce rigorously for that
and have no intention of knowingly accepting out of county waste. We would
begin planning for a transfer station and out of county disposal in 2005-2006
to assure availability in 2009.
Element 8: Educating with the Community and the Schools
Subelment Educating the
Community
Methods for Public Outreach
World Wide Web: The Department has a
well-developed web page on the Orange County web site. There are a links from
the Town of Carrboro, Chapel Hill and Hillsborough’s web pages as well. The
solid waste page was professionally upgraded in 2003, now averages 100 visitors
a day and contains comprehensive information regarding all our programs and services.
The web page also has the “A-Z Recyclery” were visitors can find resources to
recycle, reuse and repair or otherwise responsibly manage unusual waste items.
Recommendation: Update
Web site at least every sixty days.
Radio and Television: FY1999-2000 was the first
year Orange Community Recycling made extensive use of paid broadcast media.
Specifically, we have run a series of “sponsorships” on WUNC public radio to
promote Hazardous Household Waste collections, electronics recycling program, compost
bin sales, and the mixed paper recycling program. WUNC has the highest radio
listenership in Orange County. We also used cable TV to air the “Recycle Guys”
ads, adopted from the State of South Carolina, through a cooperative licensing
arrangement with the State of North Carolina. Through Triangle J Council of
Governments, we co-funded radio and television ads for the Hazardous Household
Waste Program. We have continued to use WUNC radio for special projects such as
the annual compost bin sale and continue to participate in the "Recycle
Guys" cable campaign. We used the local public access cable station to
produce and air a program about improper international disposal of electronic
waste that also discussed a North Carolina bill to provide an advance recycling
fee for lead-bearing electronics such as televisions or computer monitors.
Recommendation: Continue
to use radio and television where they are affordable. Investigate cooperative
recycling advertising with other local governments in our media market.
Investigate the possibility of regionally producing a radio or television show
on solid waste issues in the region. Continue to work with TJ COG on regional
advertising for HHW.
Newspapers: In Orange County, newspapers have been
our primary medium for advertising. We run a total of as many as 500 display
ads per year in four local papers, the Chapel Hill News, Chapel Hill Herald,
UNC Daily Tar Heel (circulation ~ 20,000) and the rural weekly News of Orange.
We use the News and Observer and bi-weekly Community Sports News as well for
additional advertising. The Chapel Hill News runs a significant number of PSAs
for us. We have submitted copies of some ads to all the papers to run as PSAs
if there’s available white space. We occasionally will run ads in a special
section e.g. if we are having a compost bin sale and the paper has a special
gardening section, we will put an ad for the compost bin sale there. Each year
the Glass Packaging Institute gives us $500 to advertise our successful
commercial glass recycling collection program in the Daily Tar Heel and the NC
Independent. In past years received significant funds from BellSouth for
phonebook recycling advertising once a year when new phone books were issued.
Due to corporate restructuring the phonebook advertising grants are no longer
available. We also run cooperative advertising with the four-county HHW
consortium in papers that reach across county lines such as the News and
Observer, NC Independent and Durham Herald-Sun. We publish monthly articles on
solid waste issues in the Chapel Hill News, Chapel Hill Herald, News of Orange
and Weaver Street Market newsletter.
Recommendation: Continue
with regular newspaper advertising, targeted radio advertising and articles,
look for additional PSA opportunities and make more use of public access
television.
Mass Mailings/Utility Bill Inserts: We develop and
mail an annual newsletter “Waste Matters” to all addresses in Orange County.
The newsletter contains basic recycling and solid waste program information and
feature articles pertinent to events over the previous year. We insert a flyer
into local newspaper publicizing our compost bin sales. We work with the Orange
Water and Sewer Authority, Town of Hillsborough Water and Sewer Department and
other utilities that will accommodate us for inserting information in their
bills to publicize our programs or include information blurbs in their customer
newsletters. We have regular columns in the employee newsletter of the Town of
Chapel Hill and Orange County regarding upcoming recycling events and current
issues. When new Bell South and UNC telephone books are distributed there is
information about telephone book recycling and our recycling programs included
with the new book, either in the yellow pages, government pages, or paid
advertising. We use placard advertising inside the Town buses to promote our
programs; space for those ads is donated by the Town.
Recommendation: Continue
with current insert programs and look for other venues such as major employee
newsletters for Blue Cross, UNC Hospitals, etc.
Take-Home Items: From the beginning of our
programs in 1987, we have given out
take-home items including refrigerator magnets, t-shirts,
bumper stickers, “chip clips”, pencils, travel mugs, school book covers and
coloring books to promote our waste reduction efforts. They continue to be
popular promotional tools.
Recommendation: Continue to distribute
take-home items at our current rate at
street fairs, with move-in
packets and for educational programs as
appropriate.
Telephone Hotlines: We have a widely publicized
recycling telephone number 968-2788 that has been used on all our materials,
advertising and take-home items for the past 12 years. The phone has featured a
recorded message that provided recycling information when the office is
closed. Now the phone information message is temporarily out of commission and
will be rebuilt this year. We also participate in the Triangle J hotline for
the HHW collection program.
Recommendation: Rebuild telephone tree
and update line periodically to ensure relevant information.
Workshops/Seminars: We typically hold two backyard
compost demonstration and training sessions per year at one of our three
compost demonstration sites. We also publicize Federal, state or
University-run seminars on waste reduction to particular sectors e.g. the hotel
waste reduction seminar and the industrial waste teleconference conducted last
year.
In 2000-2001, using a state grant, we conducted a
successful seminar for area purchasing agents on buying recycled products. It
was aimed primarily at public agency purchasers in Orange County – primarily
local governments and school systems, but others were invited.
Recommendation: Continue to hold
backyard composting demonstrations and
training sessions. Cooperate
with other area local governments and UNC on future waste reduction events.
Special Events: There are three major street fairs
in Orange County each year and several smaller ones: We have a staffed information
table at all street fairs where we also provide recycling collection services.
All street fairs now have recycling for cans and bottles. All major in-house
County functions also have recycling and composting diversion. In general,
waste diversion at County in-house events exceeds 80% and is often over 90%.
Special event recycling relies heavily on volunteer support for its success.
Recommendation: Continue to staff all
major street fairs and minor public events
with an information table and recycling
display and conduct recycling at these
events. Continue to encourage
and help facilitate food waste diversion at street
fairs.
Multifamily Outreach Program: As the County has
now taken over recycling collection at apartments, we are more aware of
recycling problems at specific apartment complexes for recycling. Collection
staff routinely reports these locations and education staff arranges for
door-to-door outreach and other on-site education including signage at cart
sites and recycling educational inserts in the apartment complex newsletters.
Recommendation: Continue this activity
as requested by collection staff at
selected apartment complexes.
C&D Waste Reduction Education: Two staff
members are employed full time in development, education and enforcement of the
County's new Regulated Recyclable Materials Ordinance. As a component of
ordinance development, they spend significant time with contractors,
developers, haulers and designers educating them on the ordinance both in group
settings and one-on-one in the office when they get permits and in the field
during pre-construction meetings. An offshoot of the RRMO has been development
of deconstruction and whole building removal efforts. Staff is integral in
conducting education on those efforts.
Recommendation:
Continue to work with contractors, designers, developers and other regulators
in education and enforcement of RRMO. Expand outreach to the broader business
community as emphasis is increased on diversion of non-construction waste
generated regulated materials.
Create Newsworthy Events: In general, the local
press is responsive to our need for coverage. Electronic media are less
responsive, we are rarely the subject of television or radio news reports.
Generally, we widely disseminate our press releases to local and regional media
as well as elected officials.
Recommendation: Produce
and promote at least one special event a year that is newsworthy.
In-House Literature: Orange Community Recycling
produces and uses a wide variety of brochures to promote our programs and
educate the public about waste reduction. Materials include: brochures about
curbside multifamily, and drop-off recycling, organic products, electronics
recycling, a landfill brochure explaining tipping fees and schedule. Most of
these brochures are available in Spanish. Our Department also publishes a
series of “Wastelines”, single information sheets that deal with special waste
issues including: computers, composting, batteries, latex paint disposal,
office recycling programs, buying recycled goods, automotive waste product
disposal, junk mail reduction.
From other sources we have used coloring books for
recycling promotion to young children, Triangle J’s HHW brochures (available in
Spanish), Cooperative Extension Service composting information. We also have an
extensive library of solid waste instructional materials that are available to
teachers and other local educators.
Recommendation: Continue to produce
and update information that covers all
programs we operate. Continue to
translate brochures and site signs into Spanish.
Block Leader Program: In the past, Orange
Community Recycling actively recruited and promoted a “block leader” approach
to recycling. This program has been discontinued as it is a very
high-maintenance volunteer effort, which we cannot staff effectively.
Additionally, it is probably more useful when a program is starting up than in
a mature program such as the one in Orange County. We now occasionally call on
Homeowners' Association leadership to assist with specific publicity like
holiday recycling schedule changes and provide literature for the
Newcomers/Welcome Wagon Association to distribute.
Recommendation: If time permits,
reevaluate Block Leader program's usefulness
and consider reviving.
Award Program: We formerly operated the “Waste
Watcher” awards program that used a waste audit procedure to recognize
businesses that reduced and recycled solid waste. The program has been dormant
for ten years. It is quite labor-intensive and did not receive a very
significant response from the business community following our pilot program.
Periodically we recognize individual volunteers in our annual newsletter or
newspaper articles for their extraordinary efforts in waste reduction. (see the
2003 Waste Matters, attached)
Recommendation: Consider
reviving the “Waste Watcher” program, especially if a mandatory recycling or
pay-as-you-throw program is implemented. Those mandates would provide
incentive to significantly reduce solid waste. Continue to recognize and
publicize those individuals and businesses that do an outstanding job in waste
reduction in Orange County.
Subelement Education
through the Schools
Statewide programs: Orange Community Recycling
makes regular use of statewide materials such as the “Recycle Guys” cards and
advertisements this year. We draw on state resources in creation of our own
recycling education programs tailored to the local situation. This year we
worked closely with State compost expert to assist an elementary school in
assessing the feasibility of on-site management of organic wastes.
Recommendation: Continue
to work closely with the state solid waste education specialist on projects of
relevance to Orange Community Recycling and use available tools to promote
recycling and waste reduction education.
Composting bins: We provide worm bins on request
to teachers who are committed to maintaining them and assist schools in
purchasing composting bins as part of overall composting grant requests. Several
schools have regularly scheduled indoor and outdoor composting demonstrations
for their grade group each year.
Recommendation: Continue
to make teachers aware that vermicomposting bins are available. Provide
training sessions and information about how to compost at school. Help maintain
the composting site at Scroggs Elementary School that diverts cafeteria
preparation waste and some food wastes brought by students.
Work with UNC Chapel Hill: UNC has a
large, highly successful recycling program across campus. We collaborate with
them as appropriate for example helping to staff the annual student orientation
event and drawing on the environmentally active student population for
recycling assistants. We also provide food waste collection to on-campus facilities
and the corollary staff education. We place recycling-related advertisements in
the Daily Tar Heel student paper. For the past two years, we have also
purchased a recycling ad in the UNC phone book. Further, UNC enforces the
County's Regulated Recyclable Materials Ordinance (RRMO) on campus
construction, demolition and remodeling and routinely cooperates with the
on-campus C&D recycling specialist.
Recommendation: Continue to seek areas
for collaboration with UNC.
One-day events: On request, Orange
Community Recycling makes age-appropriate presentations at school assemblies,
in individual classrooms and for schools and organizations that hold special
“Earth Day” type celebrations. For example, at Eno River State Park each year,
all the County middle school seventh grade classes attend a special one-day
program on environmental education where we provide an information session on
solid waste. We conduct about 60 landfill tours each year for a variety of
groups plus classroom presentations in the City and County schools.
Recommendation: As
requested, continue to assist schools in putting on recycling events and
participate in other environmental education programs conducted by the schools.
Teacher Training: We conduct formal and informal
teacher training on solid waste issues for those teachers or parent volunteers
who want to teach waste reduction in their classrooms or other educational
settings. We maintain a resource library for use by classroom teachers and
others.
Recommendation: Continue
to provide teacher training on request. Inform educators of the resources of
Orange Community Recycling
Program Implementation: Our staff provides
technical assistance on recycling contracts, use of recycled materials and
actual recycling efforts in the schools. We have not focused very much on
source reduction, but worked with Frank Porter Graham Elementary School to
conduct a school wide waste audit with a focus on organic waste diversion for
composting. Past efforts to introduce food waste separation for pickup for
commercial composting failed due to contamination.
Recommendation: Continue
to work with the schools as requested and identify
needs for program improvements in
their in-house collection and education in waste reduction.
Element 9: Special Waste
Motor oil, oil filters, lead-acid batteries, dry cell
batteries and anti-freeze
Program Expansion/Implementation: Our recycling
programs include oil, oil filters and battery recycling at all six-staffed
convenience centers. Oil filters were added in August 1999 and all sites were
upgraded; sheds were built to cover the collection areas. Batteries and oil as
well as other related fluids such as diesel fuel, kerosene and heating oil,
have been collected since the staffed sites opened in 1993. Brake fluid was
eliminated from the blend with the new contract in August 1999. Dry-cell
batteries were added to all sites in 2002. Anti-freeze is now collected only at
hazardous household waste but containers have been purchased and it will be
added to collection at all convenience centers in 2003-04.
Recommendation: Add
collection of anti-freeze at all staffed convenience centers. Continue to
publicize our own collection points, especially for oil filters. Conduct
point-of-purchase publicity for filter and dry cell battery collection programs
at auto parts and electronics stores.
Hazardous Wastes
Hazardous Household Waste Collection: In a
cooperative with Chatham, Durham and Wake counties, through the Triangle J COG,
we operate a hazardous household waste collection program at a special building
at our landfill. Last year we averaged over 200 customers per Saturday
compared to 140 the previous year. In April 2003, we selected a new contractor
and converted to four day per week collection with a full time staff attendant.
Cost per participant has declined and cost per pound is contractually fixed at
$0.60 per pound. Participation has increased. (see attached analysis). The
latex paint exchange has been discontinued.
Conditionally exempt small quantity generators (CESQGs)
We attempted a program during FY 1999-2000 with this
population and no interest was generated.
Recommendations: Continue
collection program in cooperation with other counties indefinitely.
Continuously investigate methods to reduce program costs per capita and per
pound as well as overall costs where possible, focus especially on reducing the
amount of latex paint received. Overall program cost reduction is less likely
as participation rises with population growth and increased awareness
During FY 2004-05, attempt to
establish a CESQG program in which county involvement is limited to providing
information and covering administrative costs for those who agree to haul their
hazardous waste to the landfill on an appointment basis.
Scrap Tires
Orange County Landfill complies with the State's ban on
landfilling whole scrap tires by maintaining a whole tire collection facility
from which we ship tires to a tire recycler/storage facility. We accept
limited number of tires from the public at no charge.
Recommendation: At this
time, we foresee no changes in our tire processing operation.
White goods and scrap metal
Orange County Landfill complies with the State white goods
ban by maintaining a facility for processing white goods and accepting them
from the public at a zero tipping fee. We remove motors and freon from white
goods and load our own trailers. Source-separated metal is also accepted at no
cost to comply with the County's RRMO scrap metal ban. An in-house drives the
scrap to DH Griffin in Greensboro where the white goods and other scrap are
processed and sold to mills.
Recommendation: At this
time, we foresee no changes in our white goods operation. We will consider
high-grading the scrap metal to increase the value.
Yard Waste and Clean Wood Waste
Orange County Landfill complies with the State-wide yard
waste ban by maintaining an area at the landfill to accept and process yard
waste and sell mulch resulting from grinding yard waste. Annually we grind an
average of approximately 7,000 tons of yard waste, all of which is sold as
landscape mulch or used on-site for landscaping. In addition, the County
diverts about 2,000 tons of clean wood waste a year for sale as boiler fuel,
colored decorative mulch and natural color mulch.
Recommendation: Consider
screening the mulch to create topsoil from the fines. Further investigation of
selling organic products such as compost or other topsoil blends will occur in
future years.
Septage
Orange County Landfill does not accept septage or
biosolids. Septage is accepted at the Orange Water and Sewer Authority and Town
of Hillsborough wastewater treatment plants. We do accept alum sludge from
water treatment facilities.
Element 10: Illegal Disposal and Littering Element
Litter
Orange County Landfill funds litter collection along the
length of Eubanks Road, the state road providing landfill access three times
per week. Landfill-funded crews also collect litter monthly along Rogers Road,
which approaches the landfill from the south and is used by some trucks that
may litter the roadside there. Periodically, we work with the County Sheriff’s
Department to provide additional enforcement of littering or illegal dumping in
the vicinity of the landfill. County Public Works staff is actively involved
in litter control and investigation of illegal dumping.
The landfill maintains a strict policy that all vehicles
entering or leaving the landfill carrying any materials that are not in a fully
enclosed truck are tarped. This helps prevent blowing litter. Anyone without a
tarp is required to purchase one or is turned away.
Recommendation: We have no
plans to change our current practices.
Illegal Disposal in the County:
The Solid Waste Department generally does not deal with
illegal dumping off County landfill property. The Public Works Department in
conjunction with the Sheriff's Department routinely investigates and prosecutes
illegal dumping complaints. The Solid Waste Department pursues illegal dumpers
whose addresses and names are found on waste improperly disposed at recycling
sites. Enforcement is limited to letters and phone calls requesting that the
offender recycle properly. The County District Attorney and Town of Chapel Hill
Attorney have both determined that the presence of a name and address on
improperly disposed item is not grounds for prosecution for violation of any
statute or ordinance.
Illegal Disposal at the landfill:
The Solid Waste Department maintains full-time inspectors
at both the working face of the MSW landfill and of the C&D landfill and in
the field to enforce RRMO. The primary responsibility of the inspectors is to
watch for illegal disposal of any materials that are prohibited including all
state-banned materials such as yard waste, tires, batteries, white goods,
tanks, motor oil as well as locally prohibited non-residential corrugated
cardboard, clean wood waste and scrap metal. Last fiscal year we collected
over $69,000 in penalties from those violating disposal ordinances.
Non-residentially generated corrugated cardboard was less than 4% of commercial
waste by weight, down from 10% prior to the ban in 1996. Its share of
construction waste is negligible.
Recommendation: Continue
current practices to inhibit illegal disposal at Orange County Landfill and at
construction or demolition work sites.
Element 11: Purchasing Recycled Products
Orange County does not have a formal policy for buying
recycled materials but the County Purchasing Agent reports that most paper has
30% post-consumer content as an individual requirement for purchase of recycled
paper products. The County Purchasing agent reports that over 90% of the
County’s centrally purchased paper products comply with this specification.
Some other County supplies such as parking stops, park benches, bathroom stall
dividers have some recycled content. The County is not considering a formal
policy but deals with recycled content on a case by case basis.
The Town of Chapel Hill has a much more formal purchasing
policy (see Appendix G) that requires 30% post-consumer paper and recycled
content in other products and its consideration in building construction.
Neither of the other two Towns in Orange County has adopted a purchasing policy
stipulating purchase of products with recycled content.
The County conducted a successful Buy Recycled Workshop in
2000 for members of local government and some private purchasing agents also
attended. It was successful and covered a variety of topics including paper,
construction materials and policies.
In the past year, the County Solid Waste Department has
audited all the Town and County government offices, identified which
departments have or don't purchase products with recycled content and has made
recommendations to buy recycled where appropriate.
Recommendation: In FY
2004-2005, revisit the concept of adopting a formal buy recycling County
purchasing policy that includes purchase of products, building supplies and
other goods with recycled content that has a minimum standard of post-consumer
waste included.
Element 12: Disaster Response
Orange County Landfill has accepted all solid waste from
regular disposal practices and past natural disasters including fires, floods,
hurricanes, and tornadoes. During the ice storms of FY2002-03 we accepted and
chipped 30,000 tons more wood waste than we typically do annually. We
coordinated with the State of North Carolina a mulch processing and storage
area located on current landfill property and an adjacent 14-acre parcel we
purchased. The industrial wood waste grinder we purchased in 2003 allowed the
County to keep up with the incoming wood waste because storage space for the
incoming debris was very limited. Excess chipped wood waste that cannot be sold
as mulch is being stockpiled and decomposing for future use as final cover
material during landfill closure and to be screened for recovery of topsoil for
use or sale.
Orange County acknowledges it is not adequately prepared
to efficiently/effectively manage a large storm event primarily as regards
suitable storage space in which to receive, process and store material. This
lack of space requires emergency operations to be much more intense and leaves
little margin for error or mechanical breakdown. Orange County would prefer to
establish one or more permanent permitted storm debris management facilities
and will be seeking an opportunity to discuss this emergency management
shortcoming with the Board of Commissioners. It is our goal to site and permit
a permanent storm debris management facility, perhaps in conjunction with a
landclearing and inert debris recycling facility.
Recommendation: Orange County
will seek a semi-permanent storm debris facility with ample capacity and
accessibility through discussions with the Board of County Commissioners. Informal
discussions have already taken place. In the interim Orange County will manage
storm event debris as necessary, albeit less efficiently and effectively.
Appendix G
Supporting Documentation
Buy-recycled purchasing policy (Town of Chapel
Hill only)
Additional details on work done by individual Towns
and County Public Works: town of Carrboro, Town of Chapel Hill, Town of
Hillsborough, Orange County Public Works
“Waste Matters” (copies) mailed to all addresses in Orange County 2001, 2002,
2003 issues
Wastelines* (revised or new since update submittal in
2000)
Automotive waste
Batteries, Computers
Closing the Loop (Buy Recycled)
Composting in the Backyard
Lights Containing Mercury
Office Waste Recycling Program
*NOTE: These
items are distributed on request and are on-line.
Copies of other brochures produced by Orange County Solid
Waste Management Department:
Rural curbside recycling
Urban curbside recycling
Multifamily recycling (English & Spanish)
Orange County Earth Products
Construction and Demolition Waste Reduction and Recycling
Guide
Electronics Recycling
Landfill Schedule, Rules and Regulations
A RESOLUTION SETTING STANDARDS FOR POST-CONSUMER
CONTENT IN RECYCLED PAPER PURCHASED BY THE TOWN OF CHAPEL HILL (96-5-29/R-19)
WHEREAS, a municipality's interest is served when
government agencies can make more efficient use of natural resources by
maximizing recycling and preventing waste wherever possible; and
Chapter 5 WHEREAS, the amount of
waste per capita in North Carolina actually rose in 1995, rather than
decreasing; and
Chapter
6
WHEREAS, Chapel
Hill is determined to strengthen the
role of municipal government as an enlightened, environmentally conscious
consumer; and
WHEREAS, Chapel Hill should, through cost-effective
waste prevention and recycling activities, work to conserve disposa1 capacity
and serve as a model in this regard for private and public institutions; and
WHEREAS,
the use of recycled and environmentally friendly products and services by
Chapel Hill can spur private sector development of new technologies and use of
such products, thereby creating business and employment opportunities and
enhancing regional and local economies;
NOW, THEREFORE, BE IT RESOLVED by the Council of the
Town of Chapel Hill, in celebration of Earth Day, 1996; that:
Section 1: By the end of 1996, all printing and
writing paper purchased by any municipal department or office will, except when
the cost differential is prohibitive, contain at least 20 percent post-consumer
material. Bids for such paper will be sought starting immediately upon
comp1etion of current contracts. If more cost effective, said paper shall be
purchased by the Town through State contracts.
Printing and writing paper refers to high-speed copier
paper, offset paper, computer printout paper, carbonless paper, file folders,
white woven envelopes, and other uncoated paper.
Section 2. All municipal departments and offices will,
except when the cost differential is prohibitive, purchase printing and writing
paper with at least 30 percent post-consumer material by the end of 1998.
Section 3. The post-consumer content requirements
shall apply to all printing and writing paper used for typing, computer
printing and photocopying by municipal departments and offices. All materials
printed for municipal departments or offices by outside vendors will, except
when the cost differential is prohibitive, also be printed on papers that meet
these standards for post-consumer material.
This the 29th day of May, 1996.
Town of Carrboro
Solid Waste Plan Update 2003 Additions
Town of Carrboro - Solid Waste
Collection Information for Three Year Plan Update
|
|
Residential MSW
|
Multifamily MSW
|
Commercial
MSW
|
Brush
|
Bulky Items
|
Other
|
|
Capability
|
1 rearloader
2 sideloaders
1 day a week
|
3 frontend loaders.
2 days a week
|
1 frontend loader.
Varied schedule
|
1 rearloader
2 sideloaders
1 knuckleboom as required.
Yardwaste 2 times per month
per route
|
1 boom truck
|
|
|
Practice
|
1x weekly curbside per
household
|
Free . Twice weekly.
|
Frontend loaders.
Fee for service.
Varied schedule
|
Twice per month per
household
|
As requested.
Fee for service for certain
items.
|
|
|
Units Served
|
3,100
|
|
58
|
3,100
|
|
|
|
Tons Collected
|
2,425
|
|
2,420
|
2,569
|
|
|
|
Total Cost
|
$109,730
|
|
$108,919
|
|
|
|
|
Cost per Ton
|
$45.25
|
|
$45
|
|
|
|
|
Area served
(sq. miles, pop & desc)
|
5.5 square miles
17,568 pop.
|
|
|
|
|
|
|
Cost/household/Business
|
$35.40
|
|
$1,877
|
|
|
|
|
Comments
|
|
|
$70,962.40
Revenue
|
|
|
|
Disaster/storm debris is collected by Town personnel; and
by contractors if FEMA relief is authorized. Small storm events are usually
handled as part of normal operations.
Litter control on Town Rights of Way is done mostly by the
Street Maintenance and Landscaping Divisions. Some state roads are covered by
the Adopt-A-Highway Program. Illegal dumping is handled on a case-by-case
basis. Most illegal dumping occurs on private property.
Residential waste
collection for 2004-05 will be changing to fully-automated collection, in parts
of Town where it's feasible, with the purchase of one fully-automated,
side-loading vehicle.
Town of Chapel Hill
Solid Waste Plan Update 2003 Additions
Town of Chapel Hill
Solid Waste Collection Information for Three Year Plan Update
|
|
Residential MSW
|
Multifamily MSW
|
Commercial
MSW
|
Brush
|
Bulky Items
|
Other
|
|
Capability
|
7 rearloaders
2 days a week
|
Counted as commercial
|
2 Frontloaders
1 sideloaders
|
7 R/L
2 days a week
1 knuckle boom as required
1 hooklift as required
|
1 stake bed truck
|
|
|
Practice
|
1x weekly curbside per
household
|
Once weekly collection free
8 yard container per 15 units. Fee for service thereafter.
|
Frontloaders 5 day workweek
Sideloader 2 days workweek
Fee for service.
|
1xweekly per household
|
As required
For fee $5.00 per item.
|
|
|
Units Served
|
10,764
|
|
618
|
10764
|
|
|
|
Tons Collected
|
7,899
|
|
13,103
|
6368*
|
|
|
|
Total Cost
|
$1,278,026
|
|
$1,085,239
|
$833,842
|
|
|
|
Cost per Ton
|
$162
|
|
$62
|
$131
|
|
|
|
Area served (sq. miles, pop
& desc)
|
27.2 sq.miles
|
|
|
|
|
|
|
Cost/household/
Business
|
$118.73
|
|
$1,330
|
$77.46
|
|
|
|
Comments
|
|
|
$262,887
Revenue
|
|
|
|
Disaster debris is collected
and hauled by contractors if FEMA declared and approved disaster relief is authorized
by the president. Small storm debris events are considered within normal
operations.
The Town of Chapel Hill
currently utilizes Community Service ordered persons to collect litter on main
roads and entry ways. Additionally, all state roads within the Town limits are
covered 4 times a year by state DOT adopt-a-highway program members.
The Town handles illegal dumping on a case by case basis.
Very little illegal dumping occurs on Town property. Most illegal dumping
occurs on commercial property related to commercial garbage collection points.
No foreseen program changes
or modifications this coming fiscal year.
Town of Hillsborough
Solid Waste Plan Update 2003Additions
Town
of Hillsborough Solid Waste Collection Information for Three Year Plan Update
|
|
Residential MSW
|
Multifamily MSW
|
Commercial
MSW
|
Brush
|
Bulky Items
|
Other
|
|
Capability
|
(1) 2001 Volvo WX64
/ Heil DPF Formula 7000-28 Cubic Yard automated Side Loading vehicle; (1)
1991 International 4900 Navistar Rear Loading vehicle
|
2000 Volvo Front-end
Loader, 1998 Volvo Front-end Loader,
1997 Volvo
Front-end Loader, 1996 Volvo Front-end Loader, 1991 Volvo Front-end Loader
|
(1) 1999 Ford F800XL
Knuckleboom Dump Truck
|
(1) 1996 Dodge 3500 Dump
Truck
|
|
|
Practice
|
1 time/week collected from
95 gallon Roll-out container(s)
|
1-5 times/week or request
of waste generator collected from 2cy, 4cy, 6cy, 8cy, & 8vip containers
|
5 times/week or request of
generator from curbside
|
1-5 times/week or request
of generator
|
|
|
Units
Served
|
2,100
|
109
|
2,100
|
2,100
|
|
|
Tons
Collected
|
1,822
|
2,516
|
1,009
|
Included with residential
waste
|
|
|
Total
Cost
|
$173,717
|
$141,446
|
$5,562 (disposal only)
|
Included with residential
waste
|
|
|
Cost
per Ton
|
$72.65
|
$43.40
|
|
Included with residential
waste
|
|
Area served
(sq. miles, pop & desc)
|
4.79 sq. miles
|
4.79 sq. miles
|
4.79 sq. miles
|
4.79 sq. miles
|
4.79 sq. miles
|
|
|
Cost/household
|
$82.72
|
$39.38
|
|
|
Included with residential
waste
|
|
|
Comments
|
|
|
|
|
|
|
NOTES:
1. Disaster debris is collected staged/stored at the Town’s old landfill for
disposal. Disaster debris was most recently collected by Town forces, contractors,
and through mutual aid assistance from other municipalities.
2. Litter and illegal dumping
is dealt with in the Town Code Section 11-3 Dumping or Littering on
Public or Private Property G.S. 14-399 makes the acts prohibited in
this section a misdemeanor, punishable by a fine of not more than $200.00.
therefore, this section may be enforced by the Town only through civil
penalties or injunctive relief.
3.
No changes in solid waste operations or financing are planned for 2003-04.
Orange County (Public
Works/Sanitation)
Solid Waste Plan Update 2003 Additions
Orange County Solid Waste Collection Information for Three Year Plan pdate
|
|
Residential MSW
|
Multifamily MSW
|
Commercial
MSW
|
Brush
|
Bulky Items
|
Electronics
|
Landfill Permits
|
|
Capability
|
2 front-end loaders
collecting 5 ½ days weekly (fleet of five)
|
Not applicable
|
2 front-end loaders
collecting only waste (not recyclables) from schools and gov't. buildings
(fleet of five)
|
Skid steer loaders and five
dumptrucks.
|
One pickup and/or one dump
truck dependent upon volume received
|
|
|
Practice
|
Six (6)
Solid Waste
Convenience
Centers (SWCCs)
|
Not applicable
|
Established schedule for
schools and government buildings; varies from once a week to five days weekly
|
4 days weekly from SWCCs.
2 SWCCs have roll-offs for
brush, clean wood and construction & demolition debris
|
Once to twice weekly
dependent on volume
|
Issued to all County
residents, including municipal residents
|
|
Units Served
|
36,787
|
Not applicable
|
17 schools
40 containers
3,506 services
|
10,764
|
|
|
|
Tons Collected
|
9,211
|
Not applicable
|
1,305
|
C&D
Mulch
Metal
Wht Goods
Tires
Wood
|
1,645
385
526
302
60
114
3,032
|
New program established in
2003-04 FY
|
C&D 1,706
Mulch 3,937
Metal 0.29
White G 0.25
Tires 0
Wood 4
MSW 47
|
|
|
|
|
|
|
|
|
|
Orange County Solid Waste Collection Information for
Three Year Plan Update (cont'd)
|
|
Residential MSW
|
Multifamily MSW
|
Commercial
MSW
|
Brush
|
Bulky Items
|
Electronics
|
Landfill Permits
|
|
Total Cost Collection
|
$359,500
SWCC MSW
$21/ton
|
Not applicable
|
$ 41,760
|
$359,500
|
New program established in
2003-04 FY
|
No collection cost;
Waste delivered to landfill
directly by residents
|
|
Total Cost
Tip Fees
|
$414,849
|
Not applicable
|
$ 58,725
|
C&D
Mulch
Metal
White G
Tires
Wood
|
$69,107
$6,207
0
0
0
$1,849
$77,163
|
New program established in
2003-04 FY
|
Landfill permits
$136,459
|
|
Cost per Ton
|
SWCC MSW
$ 84/ton
(tip fee, FE collection,
SWCC staffing)
|
Not applicable
|
MSW –School & Gvt Bldg
$77/ton
(tip fee, FE collection)
|
Mulch, Bulk Waste and
other-SWCC
$144/ton
|
New program established in
2003-04 FY
|
Landfill Permits
$24/ton
|
|
Area served (sq. miles, pop
& desc)
|
Households= 36,787
Square Miles=351
Population = 124,845
|
|
|
Cost/household/Business
|
SWCC MSW
$21/household
|
Not applicable
|
Cost per service
$29/service/location. 85%
of cost recovered from fee
|
Mulch and Bulk
$12
|
New program established in
2003-04 FY
|
Not applicable
|
|
|
|
|
|
|
|
|
|
|
|
|
Disaster
debris: Responsibility
is NCDOT's to collect from state system roads.
*County
only collects from government property and contractors utilized as deemed
necessary
*Dependent
upon County Manager approval, residents can transport directly to landfill
without a permit. Otherwise, permits would be required.
Small
storm debris events are considered within normal operations and residents
may transport to SWCC or by permit to Landfill.
Illegal
dumping: The
County handles illegal dumping on a case by case basis. Several agencies
respond to illegal dumping dependent upon the situation, i.e. Sanitation,
Planning, and Environmental Health. Based on citizen complaints and field
investigations, there are currently 12 known unpermitted and illegal landfills
in Orange County. The County has identified them
all by owner and TMBL. For the most part the operators are taking in
construction debris (shingles, siding, plywood, drywall) and inert debris
(stumps, dirt, limbs, bricks, curb and gutter, etc.) types of refuse. Some
landowners are also taking other types of solid waste materials, such as metal,
junk cars, trash, etc.
The
County's zoning enforcement officer has commenced enforcement action against
landfill operators to the point of issuing stop work orders in some instances;
there have been mixed results. One case is currently in court. The majority of
operators have ignored the stop work orders. None of the 12 unpermited and
illegal landfills have received zoning approval to operate and most of them
would be unable to receive zoning approval to continue operation in the manner
that they currently do. The County will determine whether to strengthen its
enforcement efforts through court action or amend the zoning rules to allow
these operations to continue.
In
either case, the public, landowners, developers, contractors and others need
information that illegal, unregulated dumping is a serious problem that could
lead to environmental, fire safety, and drinking water problems.
Litter
control: Litter
control is responsibility of NCDOT. County does collect within a small radius
of the SWCC's.
G-9
Appendix H
Appendix H Goals and Measures for the three divisions of the
solid waste Department
H-1 Administrative Division Measures and Goals
(See especially Table of Outreach Measures
page H-2)
Major Services
·
Budget administration/monitoring
of all Solid Waste Department divisions
·
Administration of accounts payable
for all divisions.
·
Operation of billings and accounts
receivable operations
·
Staff Support of County Manager
and Board of County Commissioners and coordination of Solid Waste Advisory
Board.
·
Monthly/annual
(and additional special or periodic reports) of solid waste and recycling
tonnage and revenues, including DENR required reporting.
·
Administration of the Orange County Solid
Waste Management Plan
·
Human Resources and payroll
functions for the entire department
·
Ensure compliance with all laws
and regulatory provisions for the safe/efficient operation of the mixed solid
waste and C&D landfills.
·
Solid waste public outreach and
education for landfill, recycling, waste reduction and other solid waste
services. Provide general publicity regarding the programs and services for the
public, media, builders and contractors, educators and at special events.
·
Solid waste planning
Objective
To
provide administrative and financial support for all departmental operations,
Orange County Manager, and various Boards and Commissions as necessary.
Measures
·
Conduct monthly review of budget
expenditures and reconciliation of department and Finance Department account
records
·
Execute budget amendments and
transfers as required for all divisions
·
Implement purchase orders and
changes as required for all divisions
·
Compile and issue monthly invoice
billing statement on a timely basis and record payment received on a daily
basis.
·
Provide necessary staff support
and coordination for Solid Waste Advisory Board meetings.
·
Compile monthly (and additional
special or periodic reports) of solid waste and recycling tonnage and revenues
for use by all divisions and to comply with state regulations.
·
Update and administer the Orange
County Solid Waste Management Plan.
·
Perform all Human Resources and
payroll functions for the entire department.
·
Ensure compliance with all laws
and regulatory provisions for the safe and efficient operation of the mixed
solid waste and C& D landfills.
·
Provide an effective countywide
solid waste education program.
·
Conduct analysis of long-term
financing issues, including developing alternative financing options for Board
consideration.
·
Provide necessary promotion and
advertising using all media, school presentations, and public outreach, tours,
presentations, special events, etc.
Outcomes
·
Public education and outreach
for landfill, recycling, waste reduction and other sold waste services: Provide annual newsletter, rural route calendar
cards, rural reminder cards, and ongoing program advertising and
presentations. Update all brochures annually. Maintain and continuously
update department website. Increase outreach to non-English speaking populations
in the County. Help city and county government improve their internal recycling
programs. Provide teacher training in solid waste management at public schools
in the County where appropriate. Staff all major local festivals and similar
events with solid waste information table.
·
Provide
at least 75 outreach presentations and landfill tours.
·
Place at least 550 advertisements.
·
Produce at least 45 newspaper
articles.
Measures
Outreach
and
Education
|
2000-01
Actual
|
2001-02
Actual
|
2002-03
Budget
|
2002-03
Estimate
|
2003-2004
Projected
|
Number
of ads placed
|
385
|
457
|
570
|
550
|
625
|
|
Number of presentations and
tours
|
45
|
60
|
105
|
75
|
75
|
|
Number of news articles and
radio broadcasts
|
24
|
24
|
24
|
42
|
45
|
Budget Highlights
·
Includes operational costs for additional advertising for
new programs and program expansions. New programs for FY 2002-03 include
outreach efforts for the Regulated Recyclable Materials Ordinance, and for the
permanent electronics collection program. Program expansions include service
extensions for Household Hazardous Waste, drop-off, and curbside collections.
·
Includes alternative revenue
assumptions and funds to proceed with implementation of alternative funding
mechanism.
·
Includes funds to design and
permit new solid waste administration building. Construction costs assumed to
be debt financed.
H-2
Landfill Division Measures and Goals
(See especially Table of Performance Measures page
H-8-9)

Major Services
·
Maintain and operate Orange County
Landfill, consisting of a lined Mixed Solid Waste (MSW) cell, Construction
& Demolition (C&D) landfill, Construction and Demolition Ordinance site
which includes vegetative waste, tire site, clean metal and white goods site,
organic bunkers facility, and cardboard compactor area.
·
Enforcement of Orange County Solid
Waste ordinances.
·
Operate within the State's
regulations with regard to banned materials in the current landfill.
·
Maintain all equipment to a high
level of serviceability.
·
Maintain the area around the
landfill and along the adjacent roads, including pick up of litter weekly and
mowing the grass areas.
·
Provide all environmental
monitoring activities as required by the State including gas and water well
testing.
·
Enforce the Regulated Recyclable
Material Ordinance. Issue permits and Licenses. Develop infrastructure to
provide recycling capacity for regulated/banned materials.
·
Education of construction and
demolition generators and haulers regarding waste reduction, recycling and
deconstruction.
·
Maintain emergency response
capabilities.
·
Operate White Goods and Scrap Tire
recycling functions.
·
Work with all county entities to
ensure that all construction permits issued within the county adheres to the
recycling requirements pertaining to the C&D ordinance.
Objective
·
To
provide a high quality, cost-effective and efficient service to our customers,
and to comply with all State and Local regulations.
- To
provide enforcement and material management relative to the construction
and demolition separation ordinance.
- Help
facilitate the addition of the City of Carrboro, City of Hillsborough, and Orange Counties Planning Departments into
the Solid Waste Management Plan/ Development Review process to insure that
adequate recycling infrastructure within all County developmental projects
meets waste reduction goals.
Outcomes
- Solid
waste reduction plan for new construction and demolition.
·
Continue
to enforce the ordinance banning recyclable construction materials and
requiring their source separation.
·
Limit, through waste reduction and
recycling, the amount of construction and demolition waste entering the
landfill.
·
Incorporate adequate recycling
infrastructure into all development projects within the County as well as Chapel Hill.
·
Issue permits and licenses.
Measures
|
Program Collections (tons)
|
2000-01
Actual
|
2001-02
Actual
|
2002-03
Budgeted
|
2002-03
Estimate
|
2003-04
Projected
|
|
MSW
|
58,955
|
58,578
|
56,924
|
56,500
|
56,500
|
|
C&D
|
33477
|
29,200
|
27,881
|
19,900
|
21,800
|
|
Yard Waste
|
6027
|
4,700
|
6,385
|
40,000
|
7,700
|
|
White Goods
|
416
|
467
|
450
|
399
|
400
|
|
Tires
|
1237
|
1083
|
1100
|
1059
|
1100
|
|
Gas Monitoring
|
Chapter 7 Conduct
quarterly sampling of landfill vents to comply with State regulations
|
|
Water Quality Monitoring
|
Conduct semi-annual sampling from landfill
wells, testing and analysis to comply with State regulations.
|
|
|
|
Construction
Waste
Mgmt
|
2000-01
Actual
|
2001-02
Actual
|
2002-03
Budgeted
|
2002-03
Estimate
|
2003-04
Projected
|
|
Solid Waste Mgmt
Plan/Development Review
|
108
|
91
|
100
|
110
|
100
|
|
Pre-construction
meetings
|
125
|
125
|
150
|
175
|
200
|
|
|
|
|
|
|
|
|
|
|
|
- Solid
waste reduction plan for construction and demolition. Continue timely review of plan submittals for
new development for Town of Chapel
Hill (by Town ordinance) and
others by request. Push for the remaining County entities to adopt the
plan review procedures that are currently in place and required by Chapel Hill
to ensure space is provided for recyclables storage and facilitate
reducing and recycling construction waste by providing research and
coordination service to developers.
Budget Highlights
- The
budget includes a new line item, 50861-6500 representing the debt payment
requirement for equipment that has been financed. This line also includes
the proposed debt financing for equipment that is scheduled for
replacement for fiscal year 03-04. The breakdown of this is $248,008 for
equipment that has already been debt financed and $95,296 for the 03-04
equipment purchase of a dozer for the MSW side of the landfill.
- The
capital outlay in Land Improvements (account 7425) is for the construction
of a concrete pad to store clean wood on in the RRMO area to ensure the
marketability of the material for boiler fuel.
- Capital
Improvements (account 7415) include the placement and remodeling of a
modular building that will be used as an employee’s facility and includes
locker rooms, a large common area, a kitchen, storage room, and restrooms.
This modular building was acquired free from UNC due to a construction
project on the main campus.
- Furnishings
(account 7405) includes lockers, tables, chairs, and Audio-Visual aids and
cart for training purposes to be used in the new crew building in line
item 7415.
H-3
Recycling Division Measures and Goals
(See especially Table of Recycling Measures page H-4
and H-5)
Major
Services
·
Residential
curbside recycling: provide weekly contracted curbside collection to an average
of 17,158 households and adjoining businesses in Carrboro, Chapel Hill and Hillsborough and
biweekly to 10,355 households in unincorporated area of County.
·
Multifamily
recycling: provide weekly contracted collection to an average of 230 multifamily
and government services sites throughout Orange County.
·
Drop-off site recycling at six
staffed Orange County Convenience Centers: including collection and marketing
of motor oil, oil filters, dry-cell batteries, lead acid batteries, and
antifreeze. Four of the convenience centers have salvage sheds for swapping
unwanted re-usable goods.
·
Hazardous Household Waste
collection, paint exchange and product reuse shelf: full time year-round
collection of paints, pesticides, automotive products, batteries, and household
chemicals at the Orange County Landfill.
·
Operate collection, service,
maintenance, and clean up of six unstaffed and six staffed drop-off centers
located throughout Orange County.
·
Operate collection, service,
maintenance, and clean up for additional paper / fiber route not associated
with drop-off program located throughout Orange County.
·
Operate collection, service,
maintenance, and clean up for commercial glass, metals, and plastics collection
program located throughout Orange County that services over 100 businesses.
·
Process and market materials from
programs to ensure quality and the best possible revenue for materials.
·
Maintain countywide government
buildings recycling programs, equipment, and facilities.
·
Oversee commercial food waste
collection program.
·
Operate electronics and dry-cell
battery recycling program.
Objectives
Provide
high-quality, efficient recycling services to the citizens, businesses and
institutions of Orange County and to maximize diversion of recyclable material from
the landfill.
Orange
Community Recycling, as the division is publicly known, uses a combination of
in-house staff and contractors to divert recyclable materials from Orange
County Landfill.
·
Contractors handle curbside, food
waste, oil, oil filter, and antifreeze collections and residential hazardous
wastes.
·
In-house staff handles drop-off
site recycling, multifamily, government building recycling, battery recycling,
electronics recycling, and commercial glass collection.
Outcomes
·
Urban residential curbside
recycling: increase amount of
material collected by 83 tons on annualized basis. Provide recycling services
to the total 660 new homes anticipated in this sector next year.
·
Rural residential curbside
recycling: increase amount of
material collected by 32 tons on annualized basis. Provide recycling services
to the total 360 new homes anticipated in this sector next year.
·
Multifamily recycling: reach apartment complexes in Hillsborough, increase
overall apartment complex participation from 92% of all eligible complexes to
95%. Add ten new sites. Increase amount of materials collected by 53 tons for
this program.
·
Drop-off site recycling at six
unstaffed sites and six staffed Orange County Convenience Centers: Maintain high level of service at drop-off sites and
continue to keep contamination low by site visits.
·
Hazardous Household Waste
collection and latex paint exchange:
Continue full-time program established in Spring 2003, increase amount of
hazardous waste diverted from landfill by 29%.
·
Commercial glass program: Continue to service and collect over 530 tons of
glass, metal, and plastics from over 100 businesses while keeping quality of
marketable product high.
·
Government office recycling
program: Continue every other week
collection from governmental office buildings. Add additional buildings as
need arises. Add Town of Hillsborough buildings to program.
Measures (all values given in Tons)
|
|
2000-01
Actual
|
2001-02
Actual
|
2002-03
Budgeted
|
2002-03
Estimate
|
2003-04
Projected
|
|
Curbside Recycling
·
Urban
·
Rural
|
3,352
445
|
3,302
1,056
|
3,613
1,150
|
3,302
(1)
1,278
(1)
|
3,385
1,310
|
|
Multifamily Recycling
|
1410
|
919
|
1,157
|
1,061
(1)
|
1,114
|
|
Drop off programs for
·
Oil
·
Oil filters
·
Lead-Acid Batteries
·
Dry-Cell Batteries
·
Antifreeze
|
107
7.5
60
0
n/a
|
122.2
7.7
44
1.0
n/a
|
110
10
50
6.0
60
|
122
10
70
4.5
5.0
(2)
|
125
13
70
6.0
10.0
|
|
Household Hazardous Waste
·
Hazardous Waste
·
Latex Paint
·
Metal Cans
|
44.0
5.2
4.5
|
46.7
6.6
4.3
|
54.0
7.0
5.0
|
62.0
(3)
4.0
3.75
|
80.0
4.0
n/a
|
|
·
·
Electronics Recycling
|
0
|
16.5
|
40.0
|
35.0
|
45.0
|
|
·
Government Office Recycling
|
62.2
|
62
|
131
|
78
(4)
|
80
|
|
·
Glass
|
420
|
463
|
466
|
518
|
531
|
|
·
Drop-Off
|
907
|
951
|
981
|
964
|
988
|
|
·
OCC
|
1117
|
1137
|
1175
|
1181
|
1211
|
|
·
Newspapers
|
1520
|
1720
|
1960
|
1669
|
1711
|
|
·
Magazines
|
623
|
366
|
454
|
328
|
336
|
|
·
Mixed Paper
|
883
|
883
|
900
|
1026
|
1052
|
|
·
Food Waste
|
660
|
753
|
800
|
832
|
900
|
|
·
Total
|
11,627
|
11,861
|
13,129
|
12,553
|
12,971
|
1.)
Due to an in-depth tonnage audit,
the amount of material collected by Contractor from the Urban Curbside, Rural
Curbside, and Multifamily Recycling Programs was reallocated to each program
based on new information. What results is a more accurate picture of where the
total tonnage collected is actually generated. The overall tonnage collected
by the three programs continues to rise for FY 2002-03 as compared to the
previous year (a 12% overall increase).
2.)
The Antifreeze recycling program
implementation was delayed.
3.)
Household Hazardous Waste
collected in FY 2002-03 is up 15% over the previous year due to increased
program hours and convenience to citizens.
4.)
Government Office Building
Recycling Program data for FY 2002-03 reflects actual data (material over
scale) instead of the previously estimated weights from contractor and OC
Public Works.
Types of Measures: Workload
Measures
·
Urban residential curbside
recycling: Program is scheduled to
expand to serve 660 new homes in FY 2003-04. Provide bins and weekly
collection, respond to all complaint calls by 5pm of working day following
receipt of call.
·
Rural residential curbside
recycling: Serve 360 new homes
biweekly. Respond to all complaint calls by 5pm of working day following
receipt of call.
·
Multifamily recycling: Serve new apartment complexes as they are occupied,
expand to at least five sites in Hillsborough, with over-all program expansion
of ten sites.
·
Drop-off site recycling at six
unstaffed sites and six staffed Orange County Convenience Centers: Provide regular collection of newspapers, magazines,
cardboard, mixed paper, glass, metal cans, and #1 through #7 plastic bottles.
Additionally collect motor oil, oil filters, lead-acid batteries, dry-cell
batteries, and antifreeze at intervals to prevent spills or overflows.
Increase collection of all materials by a minimum of 2.5%. Maintain salvage
sheds in working order at four solid waste convenience center locations.
·
Hazardous Household Waste
collection, latex paint exchange and product reuse shelf: Continue full-time program, increase the amount of
hazardous materials collected and diverted from Orange County Landfill by at
least 25%.
·
Commercial glass program: Increase tonnage and number of sites serviced by a
minimum of 2.5% while maintaining our outstanding level of service.
·
Government office recycling
program: Maintain service levels and
expand program to include additional governmental buildings.
Budget
Highlights
·
The increases in Capital Outlay
are due to purchase of an additional recycle-body vehicle and a Glass Crusher
for the Commercial Glass Program and the purchase of 26 eight cubic yard
containers for the collection of corrugated cardboard at drop-off sites
(previously rented).
·
Budget for contracted curbside
recycling services reflect a 5.4% cost increase and a 3% cost increase for the
food waste program.
Appendix I
Financial Plan FY203-04 through FY2013-14
Under development to be
discussed as part of budgeting process. This section will be included when
complete, prior to submittal to the state.